
With its stock down 4.8% over the past three months, it is easy to disregard Ensign Group (NASDAQ:ENSG). However, a closer look at its sound financials might cause you to think again. Given that fundamentals usually drive long-term market outcomes, the company is worth looking at. Specifically, we decided to study Ensign Group's ROE in this article.
Return on equity or ROE is an important factor to be considered by a shareholder because it tells them how effectively their capital is being reinvested. In simpler terms, it measures the profitability of a company in relation to shareholder's equity.
How Is ROE Calculated?
The formula for ROE is:
Return on Equity = Net Profit (from continuing operations) ÷ Shareholders' Equity
So, based on the above formula, the ROE for Ensign Group is:
16% = US$298m ÷ US$1.8b (Based on the trailing twelve months to December 2024).
The 'return' is the yearly profit. So, this means that for every $1 of its shareholder's investments, the company generates a profit of $0.16.
Check out our latest analysis for Ensign Group
Why Is ROE Important For Earnings Growth?
Thus far, we have learned that ROE measures how efficiently a company is generating its profits. We now need to evaluate how much profit the company reinvests or "retains" for future growth which then gives us an idea about the growth potential of the company. Generally speaking, other things being equal, firms with a high return on equity and profit retention, have a higher growth rate than firms that don’t share these attributes.
A Side By Side comparison of Ensign Group's Earnings Growth And 16% ROE
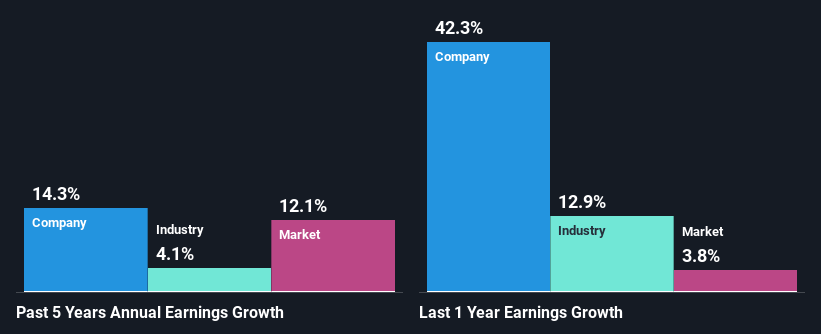
To start with, Ensign Group's ROE looks acceptable. On comparing with the average industry ROE of 11% the company's ROE looks pretty remarkable. This probably laid the ground for Ensign Group's moderate 14% net income growth seen over the past five years.
We then compared Ensign Group's net income growth with the industry and we're pleased to see that the company's growth figure is higher when compared with the industry which has a growth rate of 4.1% in the same 5-year period.
Earnings growth is an important metric to consider when valuing a stock. What investors need to determine next is if the expected earnings growth, or the lack of it, is already built into the share price. This then helps them determine if the stock is placed for a bright or bleak future. What is ENSG worth today? The intrinsic value infographic in our free research report helps visualize whether ENSG is currently mispriced by the market.
Is Ensign Group Using Its Retained Earnings Effectively?
In Ensign Group's case, its respectable earnings growth can probably be explained by its low three-year median payout ratio of 5.7% (or a retention ratio of 94%), which suggests that the company is investing most of its profits to grow its business.
Besides, Ensign Group has been paying dividends for at least ten years or more. This shows that the company is committed to sharing profits with its shareholders. Existing analyst estimates suggest that the company's future payout ratio is expected to drop to 3.9% over the next three years. However, the company's ROE is not expected to change by much despite the lower expected payout ratio.
Summary
Overall, we are quite pleased with Ensign Group's performance. Particularly, we like that the company is reinvesting heavily into its business, and at a high rate of return. Unsurprisingly, this has led to an impressive earnings growth. We also studied the latest analyst forecasts and found that the company's earnings growth is expected be similar to its current growth rate. Are these analysts expectations based on the broad expectations for the industry, or on the company's fundamentals? Click here to be taken to our analyst's forecasts page for the company.
Have feedback on this article? Concerned about the content? Get in touch with us directly. Alternatively, email editorial-team (at) simplywallst.com.
This article by Simply Wall St is general in nature. We provide commentary based on historical data and analyst forecasts only using an unbiased methodology and our articles are not intended to be financial advice. It does not constitute a recommendation to buy or sell any stock, and does not take account of your objectives, or your financial situation. We aim to bring you long-term focused analysis driven by fundamental data. Note that our analysis may not factor in the latest price-sensitive company announcements or qualitative material. Simply Wall St has no position in any stocks mentioned.