
Heidrick & Struggles International (NASDAQ:HSII) has had a rough month with its share price down 13%. But if you pay close attention, you might find that its key financial indicators look quite decent, which could mean that the stock could potentially rise in the long-term given how markets usually reward more resilient long-term fundamentals. In this article, we decided to focus on Heidrick & Struggles International's ROE.
ROE or return on equity is a useful tool to assess how effectively a company can generate returns on the investment it received from its shareholders. Simply put, it is used to assess the profitability of a company in relation to its equity capital.
How To Calculate Return On Equity?
Return on equity can be calculated by using the formula:
Return on Equity = Net Profit (from continuing operations) ÷ Shareholders' Equity
So, based on the above formula, the ROE for Heidrick & Struggles International is:
1.9% = US$8.7m ÷ US$453m (Based on the trailing twelve months to December 2024).
The 'return' is the income the business earned over the last year. That means that for every $1 worth of shareholders' equity, the company generated $0.02 in profit.
See our latest analysis for Heidrick & Struggles International
What Has ROE Got To Do With Earnings Growth?
Thus far, we have learned that ROE measures how efficiently a company is generating its profits. We now need to evaluate how much profit the company reinvests or "retains" for future growth which then gives us an idea about the growth potential of the company. Assuming all else is equal, companies that have both a higher return on equity and higher profit retention are usually the ones that have a higher growth rate when compared to companies that don't have the same features.
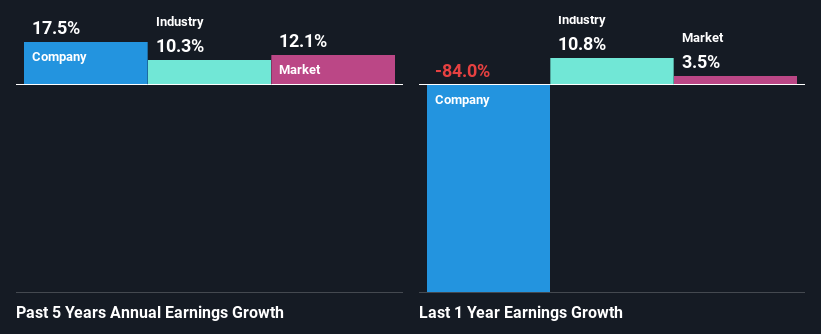
Heidrick & Struggles International's Earnings Growth And 1.9% ROE
As you can see, Heidrick & Struggles International's ROE looks pretty weak. Not just that, even compared to the industry average of 20%, the company's ROE is entirely unremarkable. Although, we can see that Heidrick & Struggles International saw a modest net income growth of 17% over the past five years. We reckon that there could be other factors at play here. For instance, the company has a low payout ratio or is being managed efficiently.
As a next step, we compared Heidrick & Struggles International's net income growth with the industry, and pleasingly, we found that the growth seen by the company is higher than the average industry growth of 10%.
Earnings growth is a huge factor in stock valuation. What investors need to determine next is if the expected earnings growth, or the lack of it, is already built into the share price. Doing so will help them establish if the stock's future looks promising or ominous. One good indicator of expected earnings growth is the P/E ratio which determines the price the market is willing to pay for a stock based on its earnings prospects. So, you may want to check if Heidrick & Struggles International is trading on a high P/E or a low P/E , relative to its industry.
Is Heidrick & Struggles International Efficiently Re-investing Its Profits?
In Heidrick & Struggles International's case, its respectable earnings growth can probably be explained by its low three-year median payout ratio of 19% (or a retention ratio of 81%), which suggests that the company is investing most of its profits to grow its business.
Additionally, Heidrick & Struggles International has paid dividends over a period of at least ten years which means that the company is pretty serious about sharing its profits with shareholders.
Conclusion
In total, it does look like Heidrick & Struggles International has some positive aspects to its business. Despite its low rate of return, the fact that the company reinvests a very high portion of its profits into its business, no doubt contributed to its high earnings growth. With that said, the latest industry analyst forecasts reveal that the company's earnings are expected to accelerate. To know more about the company's future earnings growth forecasts take a look at this free report on analyst forecasts for the company to find out more.
Have feedback on this article? Concerned about the content? Get in touch with us directly. Alternatively, email editorial-team (at) simplywallst.com.
This article by Simply Wall St is general in nature. We provide commentary based on historical data and analyst forecasts only using an unbiased methodology and our articles are not intended to be financial advice. It does not constitute a recommendation to buy or sell any stock, and does not take account of your objectives, or your financial situation. We aim to bring you long-term focused analysis driven by fundamental data. Note that our analysis may not factor in the latest price-sensitive company announcements or qualitative material. Simply Wall St has no position in any stocks mentioned.