
Across the recent three months, 10 analysts have shared their insights on Semtech (NASDAQ:SMTC), expressing a variety of opinions spanning from bullish to bearish.
The table below provides a snapshot of their recent ratings, showcasing how sentiments have evolved over the past 30 days and comparing them to the preceding months.
| Bullish | Somewhat Bullish | Indifferent | Somewhat Bearish | Bearish | |
|---|---|---|---|---|---|
| Total Ratings | 7 | 2 | 1 | 0 | 0 |
| Last 30D | 0 | 0 | 1 | 0 | 0 |
| 1M Ago | 4 | 0 | 0 | 0 | 0 |
| 2M Ago | 2 | 2 | 0 | 0 | 0 |
| 3M Ago | 1 | 0 | 0 | 0 | 0 |
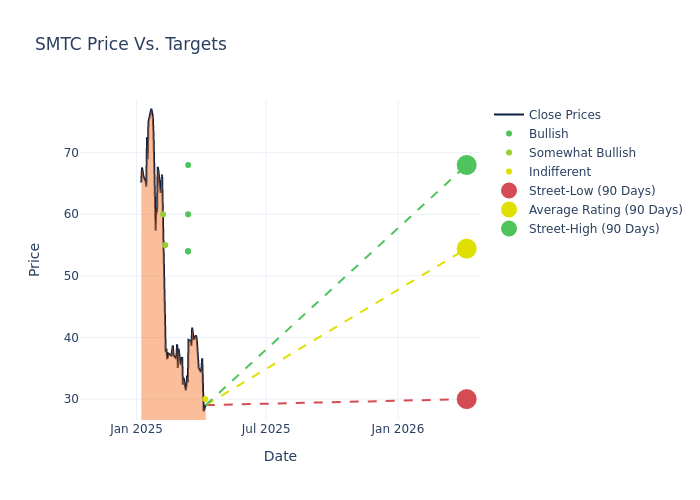
Analysts have set 12-month price targets for Semtech, revealing an average target of $59.0, a high estimate of $85.00, and a low estimate of $30.00. A negative shift in sentiment is evident as analysts have decreased the average price target by 16.45%.
Analyzing Analyst Ratings: A Detailed Breakdown
The perception of Semtech by financial experts is analyzed through recent analyst actions. The following summary presents key analysts, their recent evaluations, and adjustments to ratings and price targets.
| Analyst | Analyst Firm | Action Taken | Rating |Current Price Target| Prior Price Target | |--------------------|--------------------|---------------|---------------|--------------------|--------------------| |Joseph Moore |Morgan Stanley |Announces |Equal-Weight | $30.00|- | |Timothy Arcuri |UBS |Lowers |Buy | $60.00|$65.00 | |Tore Svanberg |Stifel |Lowers |Buy | $54.00|$60.00 | |Cody Acree |Benchmark |Lowers |Buy | $68.00|$82.00 | |Quinn Bolton |Needham |Maintains |Buy | $54.00|$54.00 | |Tore Svanberg |Stifel |Lowers |Buy | $70.00|$75.00 | |Harsh Kumar |Piper Sandler |Lowers |Overweight | $55.00|$75.00 | |Quinn Bolton |Needham |Lowers |Buy | $54.00|$74.00 | |Craig Ellis |Baird |Lowers |Outperform | $60.00|$80.00 | |Timothy Arcuri |UBS |Announces |Buy | $85.00|- |
Key Insights:
- Action Taken: Analysts adapt their recommendations to changing market conditions and company performance. Whether they 'Maintain', 'Raise' or 'Lower' their stance, it reflects their response to recent developments related to Semtech. This information provides a snapshot of how analysts perceive the current state of the company.
- Rating: Analyzing trends, analysts offer qualitative evaluations, ranging from 'Outperform' to 'Underperform'. These ratings convey expectations for the relative performance of Semtech compared to the broader market.
- Price Targets: Analysts navigate through adjustments in price targets, providing estimates for Semtech's future value. Comparing current and prior targets offers insights into analysts' evolving expectations.
Analyzing these analyst evaluations alongside relevant financial metrics can provide a comprehensive view of Semtech's market position. Stay informed and make data-driven decisions with the assistance of our Ratings Table.
Stay up to date on Semtech analyst ratings.
Get to Know Semtech Better
Semtech Corp is engaged in designing, developing, manufacturing and marketing analog and mixed-signal semiconductors, algorithms and wireless semiconductors, connectivity modules, gateways, routers and connected services for IoT. The company operates in four reportable segments: Signal Integrity, Analog Mixed Signal and Wireless, IoT Systems and IoT Connected Services. The majority of the company's revenue is earned through Analog Mixed Signal and Wireless segment. Geographically majority of the company's revenue is earned from Asia Pacific region, company also operates in North America and Europe.
Financial Insights: Semtech
Market Capitalization Analysis: Positioned below industry benchmarks, the company's market capitalization faces constraints in size. This could be influenced by factors such as growth expectations or operational capacity.
Revenue Growth: Semtech's remarkable performance in 3M is evident. As of 31 January, 2025, the company achieved an impressive revenue growth rate of 30.09%. This signifies a substantial increase in the company's top-line earnings. In comparison to its industry peers, the company stands out with a growth rate higher than the average among peers in the Information Technology sector.
Net Margin: Semtech's net margin surpasses industry standards, highlighting the company's exceptional financial performance. With an impressive 15.6% net margin, the company effectively manages costs and achieves strong profitability.
Return on Equity (ROE): The company's ROE is a standout performer, exceeding industry averages. With an impressive ROE of 19.44%, the company showcases effective utilization of equity capital.
Return on Assets (ROA): The company's ROA is a standout performer, exceeding industry averages. With an impressive ROA of 2.8%, the company showcases effective utilization of assets.
Debt Management: Semtech's debt-to-equity ratio surpasses industry norms, standing at 1.03. This suggests the company carries a substantial amount of debt, posing potential financial challenges.
The Significance of Analyst Ratings Explained
Analysts work in banking and financial systems and typically specialize in reporting for stocks or defined sectors. Analysts may attend company conference calls and meetings, research company financial statements, and communicate with insiders to publish "analyst ratings" for stocks. Analysts typically rate each stock once per quarter.
Beyond their standard evaluations, some analysts contribute predictions for metrics like growth estimates, earnings, and revenue, furnishing investors with additional guidance. Users of analyst ratings should be mindful that this specialized advice is shaped by human perspectives and may be subject to variability.
Which Stocks Are Analysts Recommending Now?
Benzinga Edge gives you instant access to all major analyst upgrades, downgrades, and price targets. Sort by accuracy, upside potential, and more. Click here to stay ahead of the market.
This article was generated by Benzinga's automated content engine and reviewed by an editor.