
Key Insights
- Institutions' substantial holdings in Ambac Financial Group implies that they have significant influence over the company's share price
- A total of 15 investors have a majority stake in the company with 51% ownership
- Using data from company's past performance alongside ownership research, one can better assess the future performance of a company
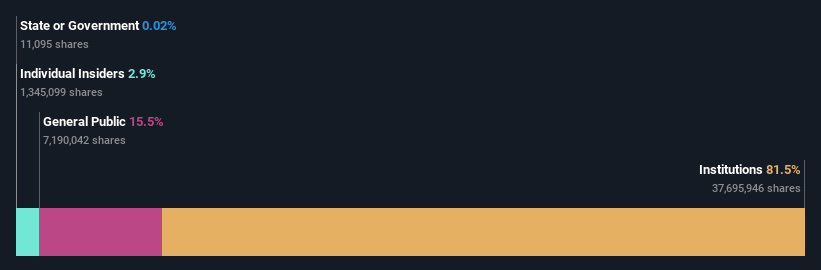
A look at the shareholders of Ambac Financial Group, Inc. (NYSE:AMBC) can tell us which group is most powerful. And the group that holds the biggest piece of the pie are institutions with 82% ownership. In other words, the group stands to gain the most (or lose the most) from their investment into the company.
And so it follows that institutional investors was the group most impacted after the company's market cap fell to US$328m last week after a 24% drop in the share price. Needless to say, the recent loss which further adds to the one-year loss to shareholders of 58% might not go down well especially with this category of shareholders. Also referred to as "smart money", institutions have a lot of sway over how a stock's price moves. Hence, if weakness in Ambac Financial Group's share price continues, institutional investors may feel compelled to sell the stock, which might not be ideal for individual investors.
In the chart below, we zoom in on the different ownership groups of Ambac Financial Group.
View our latest analysis for Ambac Financial Group
What Does The Institutional Ownership Tell Us About Ambac Financial Group?
Many institutions measure their performance against an index that approximates the local market. So they usually pay more attention to companies that are included in major indices.
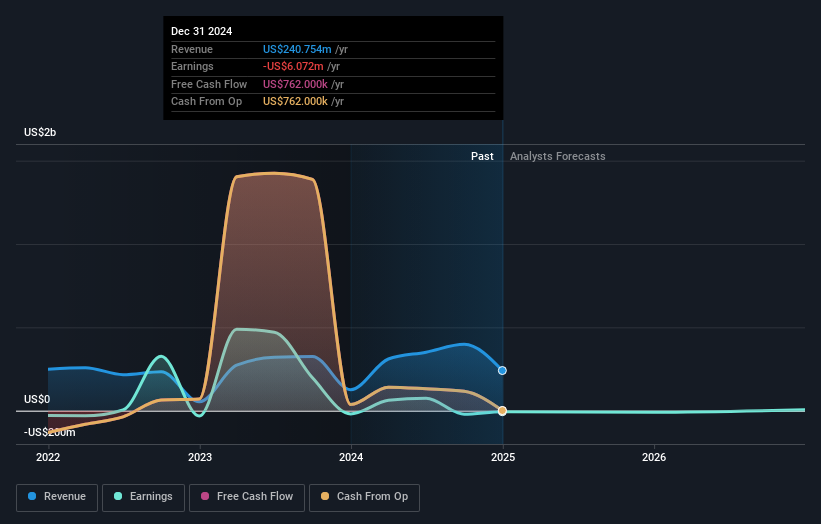
We can see that Ambac Financial Group does have institutional investors; and they hold a good portion of the company's stock. This implies the analysts working for those institutions have looked at the stock and they like it. But just like anyone else, they could be wrong. When multiple institutions own a stock, there's always a risk that they are in a 'crowded trade'. When such a trade goes wrong, multiple parties may compete to sell stock fast. This risk is higher in a company without a history of growth. You can see Ambac Financial Group's historic earnings and revenue below, but keep in mind there's always more to the story.
Investors should note that institutions actually own more than half the company, so they can collectively wield significant power. We note that hedge funds don't have a meaningful investment in Ambac Financial Group. BlackRock, Inc. is currently the largest shareholder, with 8.7% of shares outstanding. Meanwhile, the second and third largest shareholders, hold 7.0% and 5.9%, of the shares outstanding, respectively. Additionally, the company's CEO Claude LeBlanc directly holds 1.2% of the total shares outstanding.
A closer look at our ownership figures suggests that the top 15 shareholders have a combined ownership of 51% implying that no single shareholder has a majority.
While studying institutional ownership for a company can add value to your research, it is also a good practice to research analyst recommendations to get a deeper understand of a stock's expected performance. There is some analyst coverage of the stock, but it could still become more well known, with time.
Insider Ownership Of Ambac Financial Group
The definition of company insiders can be subjective and does vary between jurisdictions. Our data reflects individual insiders, capturing board members at the very least. The company management answer to the board and the latter should represent the interests of shareholders. Notably, sometimes top-level managers are on the board themselves.
I generally consider insider ownership to be a good thing. However, on some occasions it makes it more difficult for other shareholders to hold the board accountable for decisions.
We can see that insiders own shares in Ambac Financial Group, Inc.. As individuals, the insiders collectively own US$9.5m worth of the US$328m company. It is good to see some investment by insiders, but it might be worth checking if those insiders have been buying.
General Public Ownership
The general public-- including retail investors -- own 16% stake in the company, and hence can't easily be ignored. This size of ownership, while considerable, may not be enough to change company policy if the decision is not in sync with other large shareholders.
Next Steps:
While it is well worth considering the different groups that own a company, there are other factors that are even more important.
Many find it useful to take an in depth look at how a company has performed in the past. You can access this detailed graph of past earnings, revenue and cash flow .
If you would prefer discover what analysts are predicting in terms of future growth, do not miss this free report on analyst forecasts .
NB: Figures in this article are calculated using data from the last twelve months, which refer to the 12-month period ending on the last date of the month the financial statement is dated. This may not be consistent with full year annual report figures.
Have feedback on this article? Concerned about the content? Get in touch with us directly. Alternatively, email editorial-team (at) simplywallst.com.
This article by Simply Wall St is general in nature. We provide commentary based on historical data and analyst forecasts only using an unbiased methodology and our articles are not intended to be financial advice. It does not constitute a recommendation to buy or sell any stock, and does not take account of your objectives, or your financial situation. We aim to bring you long-term focused analysis driven by fundamental data. Note that our analysis may not factor in the latest price-sensitive company announcements or qualitative material. Simply Wall St has no position in any stocks mentioned.