
As of April 2025, the U.S. stock market has been experiencing significant volatility, with major indices closing sharply lower amid ongoing concerns about tariffs and their potential economic impact. This turbulent environment has investors seeking opportunities that balance potential growth with stability. Penny stocks, often representing smaller or newer companies, can offer such opportunities by providing access to growth at lower price points. While the term "penny stocks" may seem outdated, these investments continue to hold relevance for those looking to explore underappreciated sectors of the market. In this article, we will explore three promising penny stocks that exhibit strong financial foundations and could potentially offer long-term value amidst current market challenges.
Top 10 Penny Stocks In The United States
| Name | Share Price | Market Cap | Rewards & Risks |
| Safe Bulkers (NYSE:SB) | $3.05 | $337.6M | ✅ 4 ⚠️ 3 View Analysis > |
| IDenta (OTCPK:IDTA) | $0.55 | $2.23M | ✅ 2 ⚠️ 3 View Analysis > |
| Tuya (NYSE:TUYA) | $2.07 | $1.35B | ✅ 3 ⚠️ 3 View Analysis > |
| CI&T (NYSE:CINT) | $4.63 | $674.19M | ✅ 5 ⚠️ 0 View Analysis > |
| Smith Micro Software (NasdaqCM:SMSI) | $0.74 | $13.51M | ✅ 4 ⚠️ 4 View Analysis > |
| Global Self Storage (NasdaqCM:SELF) | $4.85 | $55.67M | ✅ 4 ⚠️ 1 View Analysis > |
| Flexible Solutions International (NYSEAM:FSI) | $3.52 | $48.82M | ✅ 4 ⚠️ 3 View Analysis > |
| Sensus Healthcare (NasdaqCM:SRTS) | $4.57 | $73.9M | ✅ 5 ⚠️ 3 View Analysis > |
| BAB (OTCPK:BABB) | $0.76 | $5.63M | ✅ 2 ⚠️ 3 View Analysis > |
| QuantaSing Group (NasdaqGM:QSG) | $3.08 | $222.34M | ✅ 3 ⚠️ 2 View Analysis > |
Click here to see the full list of 810 stocks from our US Penny Stocks screener.
Let's review some notable picks from our screened stocks.
GSI Technology (NasdaqGS:GSIT)
Simply Wall St Financial Health Rating: ★★★★☆☆
Overview: GSI Technology, Inc. designs, develops, and markets semiconductor memory solutions for various sectors including networking, industrial, medical, aerospace, and military across multiple countries with a market cap of $51.08 million.
Operations: The company generates revenue of $19.79 million through its design, development, and sale of integrated circuits.
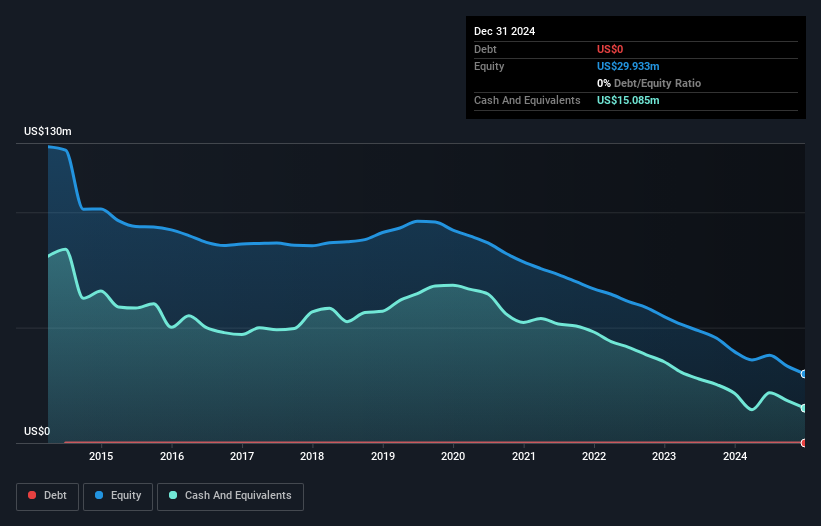
Market Cap: $51.08M
GSI Technology, Inc., with a market cap of US$51.08 million and revenue of US$19.79 million, remains unprofitable but debt-free. The company has experienced management and board teams with average tenures of 24.7 and 13.4 years respectively. Recent earnings showed a narrowing net loss compared to the previous year, while the firm anticipates fourth-quarter revenues between US$5.4 million to US$6.2 million with gross margins around 55% to 57%. A significant development is its selection by the U.S. Army for potential contracts under the SBIR program, highlighting its innovative Gemini-II technology in edge computing AI solutions for military applications.
- Click to explore a detailed breakdown of our findings in GSI Technology's financial health report.
- Understand GSI Technology's track record by examining our performance history report.
HilleVax (NasdaqGS:HLVX)
Simply Wall St Financial Health Rating: ★★★★★★
Overview: HilleVax, Inc. is a clinical-stage biopharmaceutical company dedicated to developing and commercializing novel vaccines in the United States, with a market cap of $68.91 million.
Operations: HilleVax, Inc. currently does not report any revenue segments as it is focused on developing vaccines in the United States.
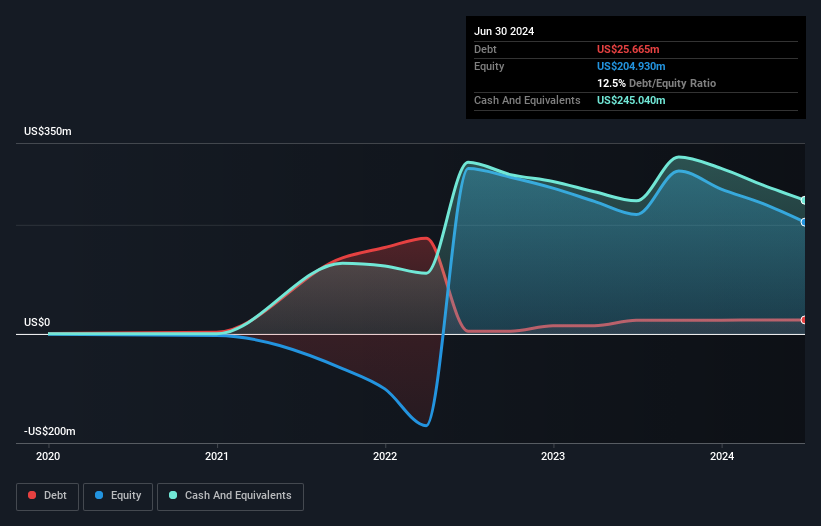
Market Cap: $68.91M
HilleVax, Inc., with a market cap of US$68.91 million, is a pre-revenue biopharmaceutical company focused on vaccine development. Despite being unprofitable and experiencing increased losses over the past five years, it remains debt-free with short-term assets of US$178.3 million exceeding liabilities. The company's management and board are experienced, averaging 2.3 and 4 years in tenure respectively. Recent earnings showed a reduced quarterly net loss of US$33.95 million compared to the previous year, indicating some cost containment efforts amidst ongoing challenges in achieving profitability within the next three years while maintaining sufficient cash runway for operations.
- Take a closer look at HilleVax's potential here in our financial health report.
- Understand HilleVax's earnings outlook by examining our growth report.
Xtra-Gold Resources (OTCPK:XTGR.F)
Simply Wall St Financial Health Rating: ★★★★★★
Overview: Xtra-Gold Resources Corp. is involved in the exploration and development of gold properties in West Africa, with a market cap of $67.63 million.
Operations: Xtra-Gold Resources does not report any specific revenue segments.
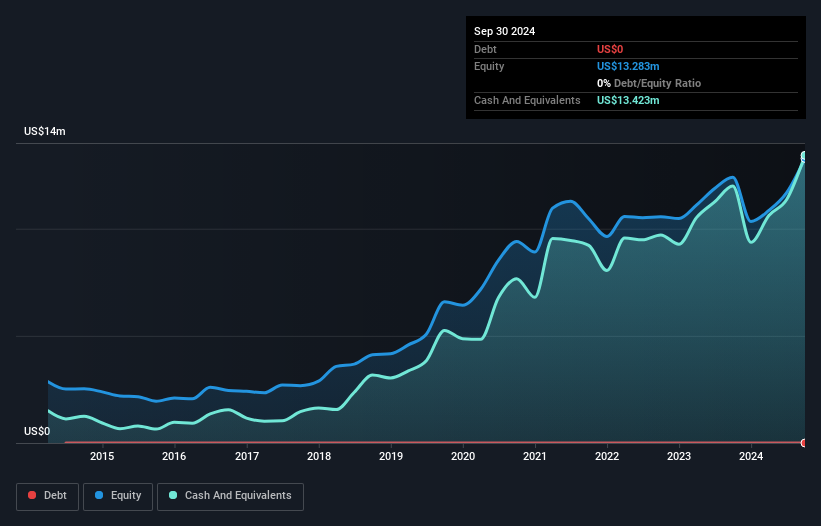
Market Cap: $67.63M
Xtra-Gold Resources Corp., with a market cap of US$67.63 million, is a pre-revenue gold exploration company operating in West Africa. The firm recently announced a share repurchase program to buy back up to 4 million shares, reflecting confidence in its valuation despite declining earnings over the past five years. Positive assay results from its Kibi Gold Project suggest potential resource expansion opportunities, although revenues remain below US$1 million. The company benefits from an experienced management team and board, stable short-term assets exceeding liabilities, no debt obligations, and trading slightly below estimated fair value amidst ongoing exploration efforts.
- Click here to discover the nuances of Xtra-Gold Resources with our detailed analytical financial health report.
- Review our historical performance report to gain insights into Xtra-Gold Resources' track record.
Seize The Opportunity
- Click through to start exploring the rest of the 807 US Penny Stocks now.
- Contemplating Other Strategies? Outshine the giants: these 24 early-stage AI stocks could fund your retirement.
This article by Simply Wall St is general in nature. We provide commentary based on historical data and analyst forecasts only using an unbiased methodology and our articles are not intended to be financial advice. It does not constitute a recommendation to buy or sell any stock, and does not take account of your objectives, or your financial situation. We aim to bring you long-term focused analysis driven by fundamental data. Note that our analysis may not factor in the latest price-sensitive company announcements or qualitative material. Simply Wall St has no position in any stocks mentioned.
Have feedback on this article? Concerned about the content? Get in touch with us directly. Alternatively, email editorial-team@simplywallst.com