
Providing a diverse range of perspectives from bullish to bearish, 4 analysts have published ratings on Thryv Holdings (NASDAQ:THRY) in the last three months.
The following table encapsulates their recent ratings, offering a glimpse into the evolving sentiments over the past 30 days and comparing them to the preceding months.
| Bullish | Somewhat Bullish | Indifferent | Somewhat Bearish | Bearish | |
|---|---|---|---|---|---|
| Total Ratings | 3 | 0 | 1 | 0 | 0 |
| Last 30D | 1 | 0 | 0 | 0 | 0 |
| 1M Ago | 1 | 0 | 1 | 0 | 0 |
| 2M Ago | 0 | 0 | 0 | 0 | 0 |
| 3M Ago | 1 | 0 | 0 | 0 | 0 |
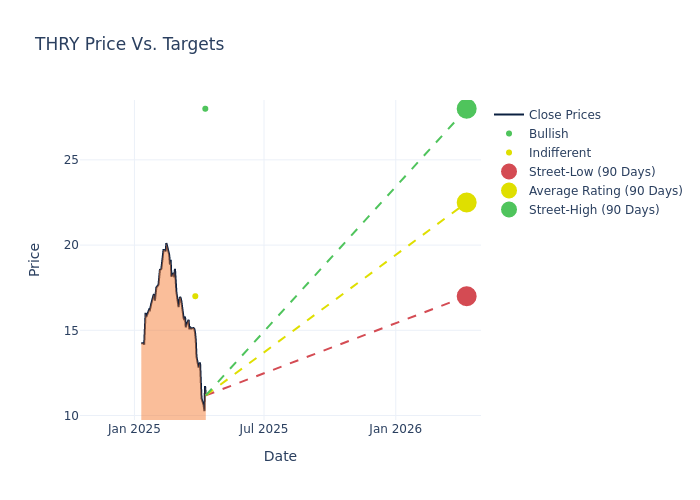
Providing deeper insights, analysts have established 12-month price targets, indicating an average target of $25.25, along with a high estimate of $28.00 and a low estimate of $17.00. A decline of 9.82% from the prior average price target is evident in the current average.
Interpreting Analyst Ratings: A Closer Look
A clear picture of Thryv Holdings's perception among financial experts is painted with a thorough analysis of recent analyst actions. The summary below outlines key analysts, their recent evaluations, and adjustments to ratings and price targets.
| Analyst | Analyst Firm | Action Taken | Rating |Current Price Target| Prior Price Target | |--------------------|--------------------|---------------|---------------|--------------------|--------------------| |Scott Berg |Needham |Maintains |Buy | $28.00|$28.00 | |Scott Berg |Needham |Maintains |Buy | $28.00|$28.00 | |Matthew Swanson |RBC Capital |Maintains |Sector Perform | $17.00|- | |Scott Berg |Needham |Maintains |Buy | $28.00|$28.00 |
Key Insights:
- Action Taken: Responding to changing market dynamics and company performance, analysts update their recommendations. Whether they 'Maintain', 'Raise', or 'Lower' their stance, it signifies their response to recent developments related to Thryv Holdings. This offers insight into analysts' perspectives on the current state of the company.
- Rating: Providing a comprehensive analysis, analysts offer qualitative assessments, ranging from 'Outperform' to 'Underperform'. These ratings reflect expectations for the relative performance of Thryv Holdings compared to the broader market.
- Price Targets: Analysts navigate through adjustments in price targets, providing estimates for Thryv Holdings's future value. Comparing current and prior targets offers insights into analysts' evolving expectations.
To gain a panoramic view of Thryv Holdings's market performance, explore these analyst evaluations alongside essential financial indicators. Stay informed and make judicious decisions using our Ratings Table.
Stay up to date on Thryv Holdings analyst ratings.
If you are interested in following small-cap stock news and performance you can start by tracking it here.
About Thryv Holdings
Thryv Holdings Inc is dedicated to supporting local, independent service-based businesses and emerging franchises by providing a cloud-based software platform, and marketing solutions to entrepreneurs. Its company is built upon a rich legacy in the marketing and advertising industry. The group are provider of SaaS all-in-one small business management software in addition to providing print and digital marketing solutions to SMBs. Its solutions enable SMB clients to attract and generate new business leads, manage their customer relationships efficiently with artificial intelligence (AI) tools and automation, and run their day-to-day operations to save time, compete and win in today's SMB environment. The group has two business segments; Thryv SaaS and Thryv Marketing Services.
Thryv Holdings's Financial Performance
Market Capitalization Analysis: Below industry benchmarks, the company's market capitalization reflects a smaller scale relative to peers. This could be attributed to factors such as growth expectations or operational capacity.
Negative Revenue Trend: Examining Thryv Holdings's financials over 3M reveals challenges. As of 31 December, 2024, the company experienced a decline of approximately -20.99% in revenue growth, reflecting a decrease in top-line earnings. In comparison to its industry peers, the company trails behind with a growth rate lower than the average among peers in the Communication Services sector.
Net Margin: Thryv Holdings's net margin excels beyond industry benchmarks, reaching 4.22%. This signifies efficient cost management and strong financial health.
Return on Equity (ROE): Thryv Holdings's ROE excels beyond industry benchmarks, reaching 5.41%. This signifies robust financial management and efficient use of shareholder equity capital.
Return on Assets (ROA): The company's ROA is a standout performer, exceeding industry averages. With an impressive ROA of 1.15%, the company showcases effective utilization of assets.
Debt Management: Thryv Holdings's debt-to-equity ratio is notably higher than the industry average. With a ratio of 1.44, the company relies more heavily on borrowed funds, indicating a higher level of financial risk.
Analyst Ratings: What Are They?
Benzinga tracks 150 analyst firms and reports on their stock expectations. Analysts typically arrive at their conclusions by predicting how much money a company will make in the future, usually the upcoming five years, and how risky or predictable that company's revenue streams are.
Analysts attend company conference calls and meetings, research company financial statements, and communicate with insiders to publish their ratings on stocks. Analysts typically rate each stock once per quarter or whenever the company has a major update.
Analysts may enhance their evaluations by incorporating forecasts for metrics like growth estimates, earnings, and revenue, delivering additional guidance to investors. It is vital to acknowledge that, although experts in stocks and sectors, analysts are human and express their opinions when providing insights.
Breaking: Wall Street's Next Big Mover
Benzinga's #1 analyst just identified a stock poised for explosive growth. This under-the-radar company could surge 200%+ as major market shifts unfold. Click here for urgent details.
This article was generated by Benzinga's automated content engine and reviewed by an editor.