
As an investor its worth striving to ensure your overall portfolio beats the market average. But in any portfolio, there are likely to be some stocks that fall short of that benchmark. Unfortunately, that's been the case for longer term Columbia Sportswear Company (NASDAQ:COLM) shareholders, since the share price is down 26% in the last three years, falling well short of the market return of around 23%. Shareholders have had an even rougher run lately, with the share price down 21% in the last 90 days. But this could be related to the weak market, which is down 9.2% in the same period.
If the past week is anything to go by, investor sentiment for Columbia Sportswear isn't positive, so let's see if there's a mismatch between fundamentals and the share price.
To quote Buffett, 'Ships will sail around the world but the Flat Earth Society will flourish. There will continue to be wide discrepancies between price and value in the marketplace...' By comparing earnings per share (EPS) and share price changes over time, we can get a feel for how investor attitudes to a company have morphed over time.
During the three years that the share price fell, Columbia Sportswear's earnings per share (EPS) dropped by 9.1% each year. So do you think it's a coincidence that the share price has dropped 9% per year, a very similar rate to the EPS? We don't. That suggests that the market sentiment around the company hasn't changed much over that time, despite the disappointment. In this case, it seems that the EPS is guiding the share price.
You can see how EPS has changed over time in the image below (click on the chart to see the exact values).
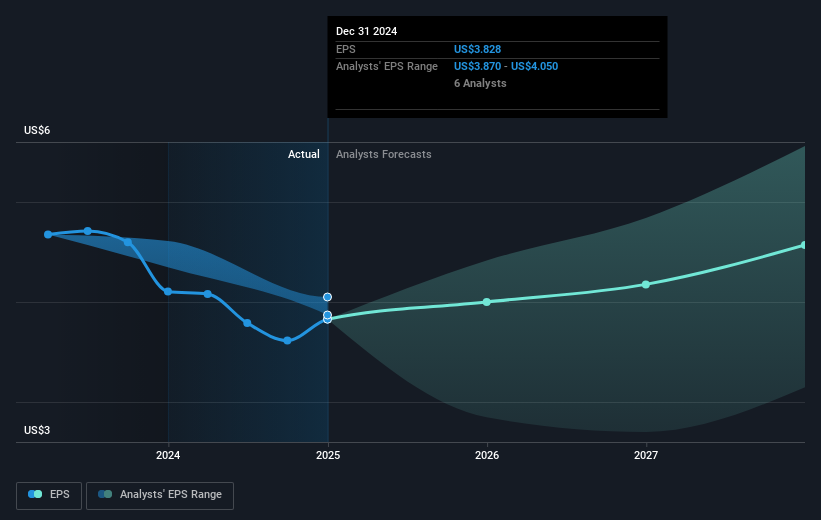
We're pleased to report that the CEO is remunerated more modestly than most CEOs at similarly capitalized companies. But while CEO remuneration is always worth checking, the really important question is whether the company can grow earnings going forward. Dive deeper into the earnings by checking this interactive graph of Columbia Sportswear's earnings, revenue and cash flow .
What About Dividends?
As well as measuring the share price return, investors should also consider the total shareholder return (TSR). Whereas the share price return only reflects the change in the share price, the TSR includes the value of dividends (assuming they were reinvested) and the benefit of any discounted capital raising or spin-off. So for companies that pay a generous dividend, the TSR is often a lot higher than the share price return. In the case of Columbia Sportswear, it has a TSR of -22% for the last 3 years. That exceeds its share price return that we previously mentioned. The dividends paid by the company have thusly boosted the total shareholder return.
A Different Perspective
Investors in Columbia Sportswear had a tough year, with a total loss of 11% (including dividends), against a market gain of about 5.1%. Even the share prices of good stocks drop sometimes, but we want to see improvements in the fundamental metrics of a business, before getting too interested. Unfortunately, last year's performance may indicate unresolved challenges, given that it was worse than the annualised loss of 0.8% over the last half decade. Generally speaking long term share price weakness can be a bad sign, though contrarian investors might want to research the stock in hope of a turnaround. It's always interesting to track share price performance over the longer term. But to understand Columbia Sportswear better, we need to consider many other factors. For instance, we've identified 1 warning sign for Columbia Sportswear that you should be aware of.
But note: Columbia Sportswear may not be the best stock to buy. So take a peek at this free list of interesting companies with past earnings growth (and further growth forecast).
Please note, the market returns quoted in this article reflect the market weighted average returns of stocks that currently trade on American exchanges.
Have feedback on this article? Concerned about the content? Get in touch with us directly. Alternatively, email editorial-team (at) simplywallst.com.
This article by Simply Wall St is general in nature. We provide commentary based on historical data and analyst forecasts only using an unbiased methodology and our articles are not intended to be financial advice. It does not constitute a recommendation to buy or sell any stock, and does not take account of your objectives, or your financial situation. We aim to bring you long-term focused analysis driven by fundamental data. Note that our analysis may not factor in the latest price-sensitive company announcements or qualitative material. Simply Wall St has no position in any stocks mentioned.