
Ratings for Olin (NYSE:OLN) were provided by 18 analysts in the past three months, showcasing a mix of bullish and bearish perspectives.
The table below provides a snapshot of their recent ratings, showcasing how sentiments have evolved over the past 30 days and comparing them to the preceding months.
| Bullish | Somewhat Bullish | Indifferent | Somewhat Bearish | Bearish | |
|---|---|---|---|---|---|
| Total Ratings | 1 | 1 | 15 | 1 | 0 |
| Last 30D | 0 | 0 | 1 | 0 | 0 |
| 1M Ago | 1 | 0 | 5 | 0 | 0 |
| 2M Ago | 0 | 0 | 2 | 0 | 0 |
| 3M Ago | 0 | 1 | 7 | 1 | 0 |
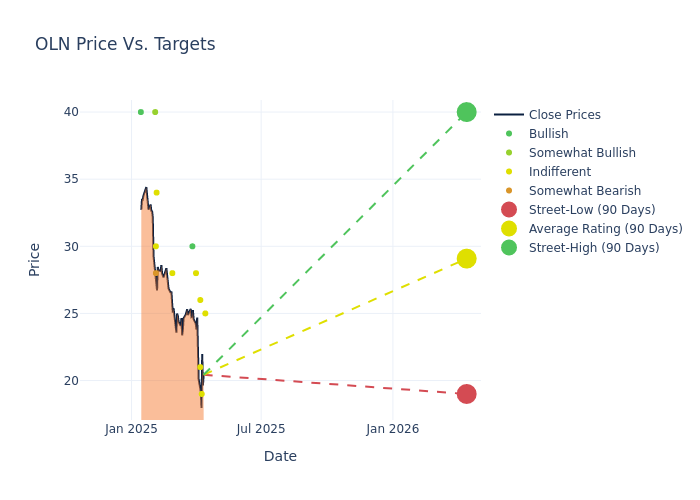
Analysts have set 12-month price targets for Olin, revealing an average target of $29.78, a high estimate of $40.00, and a low estimate of $19.00. Observing a downward trend, the current average is 20.9% lower than the prior average price target of $37.65.
Diving into Analyst Ratings: An In-Depth Exploration
In examining recent analyst actions, we gain insights into how financial experts perceive Olin. The following summary outlines key analysts, their recent evaluations, and adjustments to ratings and price targets.
| Analyst | Analyst Firm | Action Taken | Rating |Current Price Target| Prior Price Target | |--------------------|--------------------|---------------|---------------|--------------------|--------------------| |Peter Osterland |Truist Securities |Lowers |Hold | $25.00|$32.00 | |Michael Sison |Wells Fargo |Lowers |Equal-Weight | $19.00|$25.00 | |Joshua Spector |UBS |Lowers |Neutral | $21.00|$34.00 | |Charles Neivert |Piper Sandler |Lowers |Neutral | $26.00|$33.00 | |Michael Sison |Wells Fargo |Lowers |Equal-Weight | $25.00|$31.00 | |Michael Leithead |Barclays |Lowers |Equal-Weight | $28.00|$34.00 | |Patrick Cunningham |Citigroup |Lowers |Buy | $30.00|$34.00 | |Jeffrey Zekauskas |JP Morgan |Lowers |Neutral | $28.00|$50.00 | |Charles Neivert |Piper Sandler |Lowers |Neutral | $33.00|$41.00 | |Bhavesh Lodaya |BMO Capital |Lowers |Market Perform | $34.00|$44.00 | |Arun Viswanathan |RBC Capital |Lowers |Sector Perform | $30.00|$45.00 | |Angel Castillo |Morgan Stanley |Lowers |Underweight | $28.00|$31.00 | |Michael Leithead |Barclays |Lowers |Equal-Weight | $34.00|$43.00 | |Peter Osterland |Truist Securities |Lowers |Hold | $32.00|$38.00 | |Michael Sison |Wells Fargo |Lowers |Equal-Weight | $31.00|$40.00 | |Aleksey Yefremov |Keybanc |Lowers |Overweight | $40.00|$50.00 | |Joshua Spector |UBS |Lowers |Neutral | $34.00|$35.00 | |Peter Osterland |Truist Securities |Announces |Hold | $38.00|- |
Key Insights:
- Action Taken: Analysts frequently update their recommendations based on evolving market conditions and company performance. Whether they 'Maintain', 'Raise' or 'Lower' their stance, it reflects their reaction to recent developments related to Olin. This information provides a snapshot of how analysts perceive the current state of the company.
- Rating: Analysts unravel qualitative evaluations for stocks, ranging from 'Outperform' to 'Underperform'. These ratings offer insights into expectations for the relative performance of Olin compared to the broader market.
- Price Targets: Analysts predict movements in price targets, offering estimates for Olin's future value. Examining the current and prior targets offers insights into analysts' evolving expectations.
Considering these analyst evaluations in conjunction with other financial indicators can offer a comprehensive understanding of Olin's market position. Stay informed and make well-informed decisions with our Ratings Table.
Stay up to date on Olin analyst ratings.
About Olin
Olin Corp manufactures and sells a variety of chemicals and chemical-based products. The company organizes itself into three segments based on the product type. The Chlor alkali products and Vinyls segment, which generates the majority of revenue, sells chlorine and caustic soda, which are used in a variety of industries including cosmetics, textiles, crop protection, and fire protection products. The Epoxy segment sells epoxy resins used in paints and coatings. The Winchester segment sells sporting ammunition and ammunition accessories under the Winchester brand. The majority of revenue comes from the United States.
Key Indicators: Olin's Financial Health
Market Capitalization Analysis: Below industry benchmarks, the company's market capitalization reflects a smaller scale relative to peers. This could be attributed to factors such as growth expectations or operational capacity.
Revenue Growth: Olin's revenue growth over a period of 3M has been noteworthy. As of 31 December, 2024, the company achieved a revenue growth rate of approximately 3.51%. This indicates a substantial increase in the company's top-line earnings. As compared to competitors, the company surpassed expectations with a growth rate higher than the average among peers in the Materials sector.
Net Margin: Olin's net margin surpasses industry standards, highlighting the company's exceptional financial performance. With an impressive 0.64% net margin, the company effectively manages costs and achieves strong profitability.
Return on Equity (ROE): The company's ROE is below industry benchmarks, signaling potential difficulties in efficiently using equity capital. With an ROE of 0.52%, the company may need to address challenges in generating satisfactory returns for shareholders.
Return on Assets (ROA): The company's ROA is a standout performer, exceeding industry averages. With an impressive ROA of 0.14%, the company showcases effective utilization of assets.
Debt Management: Olin's debt-to-equity ratio stands notably higher than the industry average, reaching 1.56. This indicates a heavier reliance on borrowed funds, raising concerns about financial leverage.
Analyst Ratings: What Are They?
Ratings come from analysts, or specialists within banking and financial systems that report for specific stocks or defined sectors (typically once per quarter for each stock). Analysts usually derive their information from company conference calls and meetings, financial statements, and conversations with important insiders to reach their decisions.
Some analysts also offer predictions for helpful metrics such as earnings, revenue, and growth estimates to provide further guidance as to what to do with certain tickers. It is important to keep in mind that while stock and sector analysts are specialists, they are also human and can only forecast their beliefs to traders.
Breaking: Wall Street's Next Big Mover
Benzinga's #1 analyst just identified a stock poised for explosive growth. This under-the-radar company could surge 200%+ as major market shifts unfold. Click here for urgent details.
This article was generated by Benzinga's automated content engine and reviewed by an editor.