
With its stock down 13% over the past three months, it is easy to disregard Cooper Companies (NASDAQ:COO). We, however decided to study the company's financials to determine if they have got anything to do with the price decline. Long-term fundamentals are usually what drive market outcomes, so it's worth paying close attention. Specifically, we decided to study Cooper Companies' ROE in this article.
Return on equity or ROE is an important factor to be considered by a shareholder because it tells them how effectively their capital is being reinvested. In simpler terms, it measures the profitability of a company in relation to shareholder's equity.
We check all companies for important risks. See what we found for Cooper Companies in our free report.How To Calculate Return On Equity?
The formula for return on equity is:
Return on Equity = Net Profit (from continuing operations) ÷ Shareholders' Equity
So, based on the above formula, the ROE for Cooper Companies is:
5.1% = US$415m ÷ US$8.1b (Based on the trailing twelve months to January 2025).
The 'return' is the profit over the last twelve months. That means that for every $1 worth of shareholders' equity, the company generated $0.05 in profit.
View our latest analysis for Cooper Companies
Why Is ROE Important For Earnings Growth?
Thus far, we have learned that ROE measures how efficiently a company is generating its profits. We now need to evaluate how much profit the company reinvests or "retains" for future growth which then gives us an idea about the growth potential of the company. Assuming everything else remains unchanged, the higher the ROE and profit retention, the higher the growth rate of a company compared to companies that don't necessarily bear these characteristics.
A Side By Side comparison of Cooper Companies' Earnings Growth And 5.1% ROE
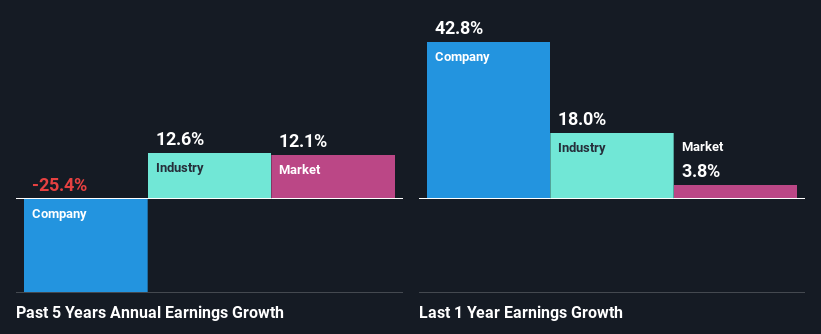
When you first look at it, Cooper Companies' ROE doesn't look that attractive. Next, when compared to the average industry ROE of 12%, the company's ROE leaves us feeling even less enthusiastic. Therefore, it might not be wrong to say that the five year net income decline of 25% seen by Cooper Companies was probably the result of it having a lower ROE. However, there could also be other factors causing the earnings to decline. Such as - low earnings retention or poor allocation of capital.
However, when we compared Cooper Companies' growth with the industry we found that while the company's earnings have been shrinking, the industry has seen an earnings growth of 13% in the same period. This is quite worrisome.
Earnings growth is a huge factor in stock valuation. It’s important for an investor to know whether the market has priced in the company's expected earnings growth (or decline). By doing so, they will have an idea if the stock is headed into clear blue waters or if swampy waters await. Is COO fairly valued? This infographic on the company's intrinsic value has everything you need to know.
Is Cooper Companies Using Its Retained Earnings Effectively?
While the company did payout a portion of its dividend in the past, it currently doesn't pay a regular dividend. This implies that potentially all of its profits are being reinvested in the business.
Conclusion
On the whole, we feel that the performance shown by Cooper Companies can be open to many interpretations. Even though it appears to be retaining most of its profits, given the low ROE, investors may not be benefitting from all that reinvestment after all. The low earnings growth suggests our theory correct. Having said that, looking at current analyst estimates, we found that the company's earnings growth rate is expected to see a huge improvement. Are these analysts expectations based on the broad expectations for the industry, or on the company's fundamentals? Click here to be taken to our analyst's forecasts page for the company.
Have feedback on this article? Concerned about the content? Get in touch with us directly. Alternatively, email editorial-team (at) simplywallst.com.
This article by Simply Wall St is general in nature. We provide commentary based on historical data and analyst forecasts only using an unbiased methodology and our articles are not intended to be financial advice. It does not constitute a recommendation to buy or sell any stock, and does not take account of your objectives, or your financial situation. We aim to bring you long-term focused analysis driven by fundamental data. Note that our analysis may not factor in the latest price-sensitive company announcements or qualitative material. Simply Wall St has no position in any stocks mentioned.