
In the latest quarter, 6 analysts provided ratings for BXP (NYSE:BXP), showcasing a mix of bullish and bearish perspectives.
The table below provides a snapshot of their recent ratings, showcasing how sentiments have evolved over the past 30 days and comparing them to the preceding months.
| Bullish | Somewhat Bullish | Indifferent | Somewhat Bearish | Bearish | |
|---|---|---|---|---|---|
| Total Ratings | 1 | 3 | 2 | 0 | 0 |
| Last 30D | 0 | 1 | 0 | 0 | 0 |
| 1M Ago | 1 | 0 | 0 | 0 | 0 |
| 2M Ago | 0 | 0 | 2 | 0 | 0 |
| 3M Ago | 0 | 2 | 0 | 0 | 0 |
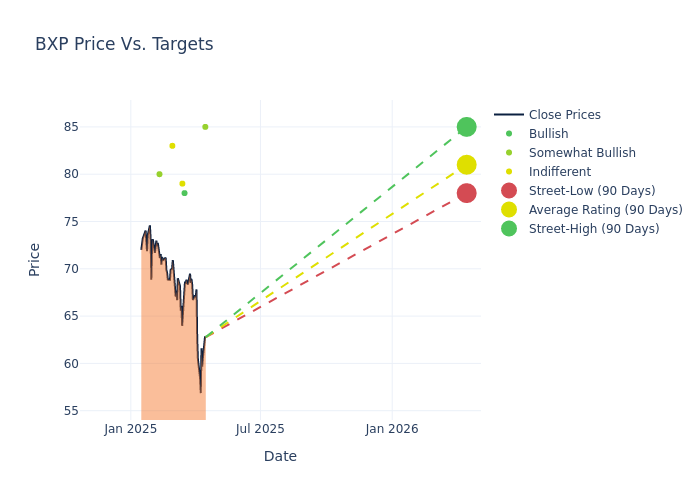
Analysts provide deeper insights through their assessments of 12-month price targets, revealing an average target of $84.17, a high estimate of $100.00, and a low estimate of $78.00. A negative shift in sentiment is evident as analysts have decreased the average price target by 9.88%.
Analyzing Analyst Ratings: A Detailed Breakdown
A comprehensive examination of how financial experts perceive BXP is derived from recent analyst actions. The following is a detailed summary of key analysts, their recent evaluations, and adjustments to ratings and price targets.
| Analyst | Analyst Firm | Action Taken | Rating |Current Price Target| Prior Price Target | |--------------------|--------------------|---------------|---------------|--------------------|--------------------| |Alexander Goldfarb |Piper Sandler |Lowers |Overweight | $85.00|$100.00 | |Peter Abramowitz |Jefferies |Announces |Buy | $78.00|- | |Anthony Powell |Barclays |Lowers |Equal-Weight | $79.00|$89.00 | |Nicholas Yulico |Scotiabank |Lowers |Sector Perform | $83.00|$85.00 | |Blaine Heck |Wells Fargo |Lowers |Overweight | $80.00|$88.00 | |Alexander Goldfarb |Piper Sandler |Lowers |Overweight | $100.00|$105.00 |
Key Insights:
- Action Taken: In response to dynamic market conditions and company performance, analysts update their recommendations. Whether they 'Maintain', 'Raise', or 'Lower' their stance, it signifies their reaction to recent developments related to BXP. This insight gives a snapshot of analysts' perspectives on the current state of the company.
- Rating: Gaining insights, analysts provide qualitative assessments, ranging from 'Outperform' to 'Underperform'. These ratings reflect expectations for the relative performance of BXP compared to the broader market.
- Price Targets: Delving into movements, analysts provide estimates for the future value of BXP's stock. This analysis reveals shifts in analysts' expectations over time.
Understanding these analyst evaluations alongside key financial indicators can offer valuable insights into BXP's market standing. Stay informed and make well-considered decisions with our Ratings Table.
Stay up to date on BXP analyst ratings.
Discovering BXP: A Closer Look
BXP Inc. owns over 180 properties consisting of approximately 53 million rentable square feet of space. The portfolio is dominated by office buildings and is spread across major cities such as New York, Boston, San Francisco, Los Angeles, Seattle, and the Washington, D.C., region. The real estate investment trust also owns limited retail, hotel, and residential properties.
BXP's Economic Impact: An Analysis
Market Capitalization Analysis: Above industry benchmarks, the company's market capitalization emphasizes a noteworthy size, indicative of a strong market presence.
Revenue Growth: BXP's revenue growth over a period of 3M has been noteworthy. As of 31 December, 2024, the company achieved a revenue growth rate of approximately 3.58%. This indicates a substantial increase in the company's top-line earnings. As compared to competitors, the company surpassed expectations with a growth rate higher than the average among peers in the Real Estate sector.
Net Margin: BXP's net margin falls below industry averages, indicating challenges in achieving strong profitability. With a net margin of -26.66%, the company may face hurdles in effective cost management.
Return on Equity (ROE): BXP's ROE lags behind industry averages, suggesting challenges in maximizing returns on equity capital. With an ROE of -4.1%, the company may face hurdles in achieving optimal financial performance.
Return on Assets (ROA): BXP's ROA lags behind industry averages, suggesting challenges in maximizing returns from its assets. With an ROA of -0.87%, the company may face hurdles in achieving optimal financial performance.
Debt Management: BXP's debt-to-equity ratio is notably higher than the industry average. With a ratio of 3.14, the company relies more heavily on borrowed funds, indicating a higher level of financial risk.
The Significance of Analyst Ratings Explained
Benzinga tracks 150 analyst firms and reports on their stock expectations. Analysts typically arrive at their conclusions by predicting how much money a company will make in the future, usually the upcoming five years, and how risky or predictable that company's revenue streams are.
Analysts attend company conference calls and meetings, research company financial statements, and communicate with insiders to publish their ratings on stocks. Analysts typically rate each stock once per quarter or whenever the company has a major update.
Analysts may supplement their ratings with predictions for metrics like growth estimates, earnings, and revenue, offering investors a more comprehensive outlook. However, investors should be mindful that analysts, like any human, can have subjective perspectives influencing their forecasts.
Breaking: Wall Street's Next Big Mover
Benzinga's #1 analyst just identified a stock poised for explosive growth. This under-the-radar company could surge 200%+ as major market shifts unfold. Click here for urgent details.
This article was generated by Benzinga's automated content engine and reviewed by an editor.