Top 2 Utilities Stocks That Could Lead To Your Biggest Gains In April

Benzinga · 04/17 11:48
Share
Listen to the news
The most oversold stocks in the utilities sector presents an opportunity to buy into undervalued companies.
The RSI is a momentum indicator, which compares a stock’s strength on days when prices go up to its strength on days when prices go down. When compared to a stock’s price action, it can give traders a better sense of how a stock may perform in the short term. An asset is typically considered oversold when the RSI is below 30, according to Benzinga Pro.
Here's the latest list of major oversold players in this sector, having an RSI near or below 30.
Sunnova Energy International Inc (NYSE:NOVA)
- On April 11, Sunnova announced appointment of two independent directors. The company's stock fell around 44% over the past month and has a 52-week low of $0.18.
- RSI Value: 22.4
- NOVA Price Action: Shares of Sunnova Energy fell 18.3% to close at $0.19 on Wednesday.
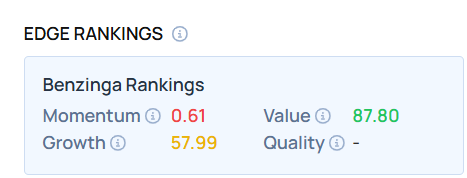
- Edge Stock Ratings: 0.61 Momentum score with Value at 87.80.
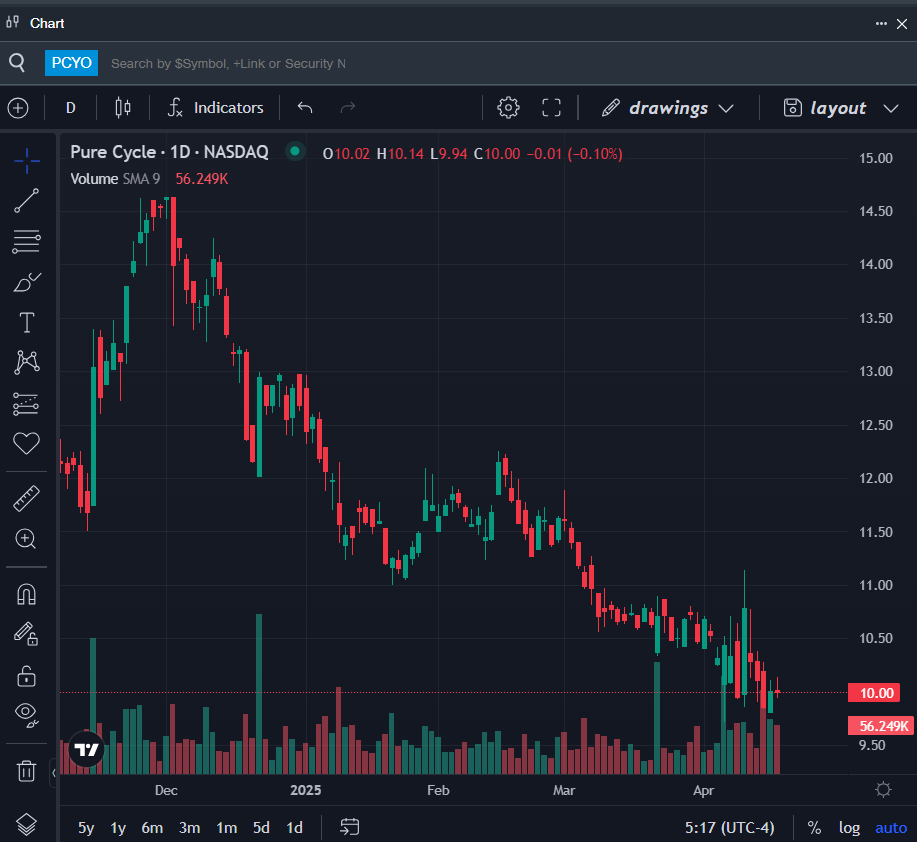
Pure Cycle Corp (NASDAQ:PCYO)
- On April 9, the company said revenues for the three and six months ended February 28, came in at $4.0 million and $9.7 million. “Despite typical winter slowdowns, Pure Cycle maintained positive net income in the quarter, leveraging its robust balance sheet and diversified asset portfolio. Our earnings showcased the strength of our oil and gas royalty portfolio through our royalty income and the strength of our water and wastewater infrastructure through our water and wastewater tap sales. We continue to see strong demand for our entry-level housing at Sky Ranch as we expand development across multiple subphases,” stated Marc Spezialy, CFO of Pure Cycle. The company's stock fell around 7% over the past month and has a 52-week low of $8.94.
- RSI Value: 19.7
- PCYO Price Action: Shares of Pure Cycle fell 0.1% to close at $10.00 on Wednesday.
- Benzinga Pro’s charting tool helped identify the trend in PCYO stock.
Learn more about BZ Edge Rankings—click to see scores for other stocks in the sector and see how they compare.
Read This Next:
Photo via Shutterstock
Disclaimer:This article represents the opinion of the author only. It does not represent the opinion of Webull, nor should it be viewed as an indication that Webull either agrees with or confirms the truthfulness or accuracy of the information. It should not be considered as investment advice from Webull or anyone else, nor should it be used as the basis of any investment decision.
What's Trending
No content on the Webull website shall be considered a recommendation or solicitation for the purchase or sale of securities, options or other investment products. All information and data on the website is for reference only and no historical data shall be considered as the basis for judging future trends.
Copyright © 2025 Webull. All Rights Reserved