
While TD SYNNEX Corporation (NYSE:SNX) shareholders are probably generally happy, the stock hasn't had particularly good run recently, with the share price falling 25% in the last quarter. On the bright side the share price is up over the last half decade. In that time, it is up 34%, which isn't bad, but is below the market return of 98%.
So let's assess the underlying fundamentals over the last 5 years and see if they've moved in lock-step with shareholder returns.
Our free stock report includes 2 warning signs investors should be aware of before investing in TD SYNNEX. Read for free now.To paraphrase Benjamin Graham: Over the short term the market is a voting machine, but over the long term it's a weighing machine. One imperfect but simple way to consider how the market perception of a company has shifted is to compare the change in the earnings per share (EPS) with the share price movement.
TD SYNNEX's earnings per share are down 3.0% per year, despite strong share price performance over five years.
By glancing at these numbers, we'd posit that the decline in earnings per share is not representative of how the business has changed over the years. Therefore, it's worth taking a look at other metrics to try to understand the share price movements.
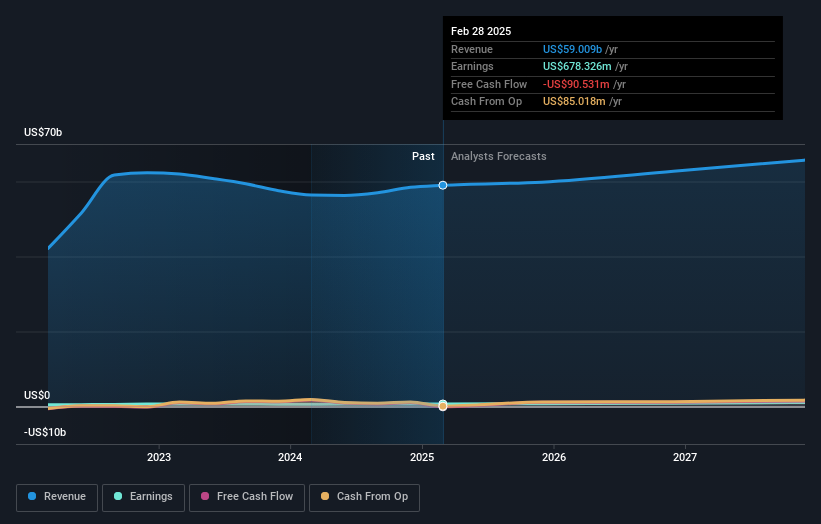
The modest 1.7% dividend yield is unlikely to be propping up the share price. In contrast revenue growth of 23% per year is probably viewed as evidence that TD SYNNEX is growing, a real positive. It's quite possible that management are prioritizing revenue growth over EPS growth at the moment.
The image below shows how earnings and revenue have tracked over time (if you click on the image you can see greater detail).
We're pleased to report that the CEO is remunerated more modestly than most CEOs at similarly capitalized companies. But while CEO remuneration is always worth checking, the really important question is whether the company can grow earnings going forward. This free report showing analyst forecasts should help you form a view on TD SYNNEX
What About Dividends?
When looking at investment returns, it is important to consider the difference between total shareholder return (TSR) and share price return. The TSR incorporates the value of any spin-offs or discounted capital raisings, along with any dividends, based on the assumption that the dividends are reinvested. So for companies that pay a generous dividend, the TSR is often a lot higher than the share price return. As it happens, TD SYNNEX's TSR for the last 5 years was 182%, which exceeds the share price return mentioned earlier. And there's no prize for guessing that the dividend payments largely explain the divergence!
A Different Perspective
Investors in TD SYNNEX had a tough year, with a total loss of 6.7% (including dividends), against a market gain of about 7.4%. Even the share prices of good stocks drop sometimes, but we want to see improvements in the fundamental metrics of a business, before getting too interested. Longer term investors wouldn't be so upset, since they would have made 23%, each year, over five years. It could be that the recent sell-off is an opportunity, so it may be worth checking the fundamental data for signs of a long term growth trend. While it is well worth considering the different impacts that market conditions can have on the share price, there are other factors that are even more important. Consider for instance, the ever-present spectre of investment risk. We've identified 2 warning signs with TD SYNNEX (at least 1 which is concerning) , and understanding them should be part of your investment process.
If you are like me, then you will not want to miss this free list of undervalued small caps that insiders are buying.
Please note, the market returns quoted in this article reflect the market weighted average returns of stocks that currently trade on American exchanges.
Have feedback on this article? Concerned about the content? Get in touch with us directly. Alternatively, email editorial-team (at) simplywallst.com.
This article by Simply Wall St is general in nature. We provide commentary based on historical data and analyst forecasts only using an unbiased methodology and our articles are not intended to be financial advice. It does not constitute a recommendation to buy or sell any stock, and does not take account of your objectives, or your financial situation. We aim to bring you long-term focused analysis driven by fundamental data. Note that our analysis may not factor in the latest price-sensitive company announcements or qualitative material. Simply Wall St has no position in any stocks mentioned.