
In the last three months, 9 analysts have published ratings on Snap-on (NYSE:SNA), offering a diverse range of perspectives from bullish to bearish.
Summarizing their recent assessments, the table below illustrates the evolving sentiments in the past 30 days and compares them to the preceding months.
| Bullish | Somewhat Bullish | Indifferent | Somewhat Bearish | Bearish | |
|---|---|---|---|---|---|
| Total Ratings | 2 | 5 | 2 | 0 | 0 |
| Last 30D | 0 | 0 | 1 | 0 | 0 |
| 1M Ago | 1 | 2 | 1 | 0 | 0 |
| 2M Ago | 1 | 0 | 0 | 0 | 0 |
| 3M Ago | 0 | 3 | 0 | 0 | 0 |
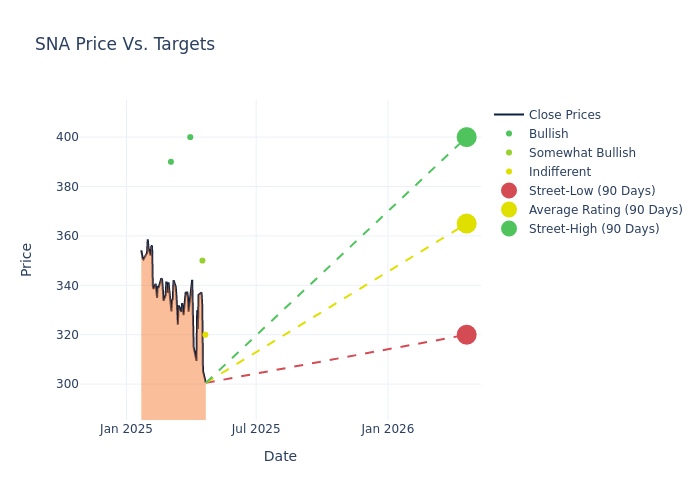
In the assessment of 12-month price targets, analysts unveil insights for Snap-on, presenting an average target of $357.67, a high estimate of $400.00, and a low estimate of $320.00. This upward trend is apparent, with the current average reflecting a 0.33% increase from the previous average price target of $356.50.
Exploring Analyst Ratings: An In-Depth Overview
A comprehensive examination of how financial experts perceive Snap-on is derived from recent analyst actions. The following is a detailed summary of key analysts, their recent evaluations, and adjustments to ratings and price targets.
| Analyst | Analyst Firm | Action Taken | Rating |Current Price Target| Prior Price Target | |--------------------|--------------------|---------------|---------------|--------------------|--------------------| |Luke Junk |Baird |Lowers |Neutral | $320.00|$349.00 | |Gary Prestopino |Barrington Research |Maintains |Outperform | $350.00|$350.00 | |Luke Junk |Baird |Lowers |Neutral | $349.00|$358.00 | |Gary Prestopino |Barrington Research |Maintains |Outperform | $350.00|$350.00 | |David Macgregor |Longbow Research |Announces |Buy | $400.00|- | |Ivan Feinseth |Tigress Financial |Raises |Buy | $390.00|$385.00 | |Gary Prestopino |Barrington Research |Maintains |Outperform | $350.00|$350.00 | |Gary Prestopino |Barrington Research |Maintains |Outperform | $350.00|$350.00 | |Gary Prestopino |Barrington Research |Maintains |Outperform | $360.00|$360.00 |
Key Insights:
- Action Taken: Analysts frequently update their recommendations based on evolving market conditions and company performance. Whether they 'Maintain', 'Raise' or 'Lower' their stance, it reflects their reaction to recent developments related to Snap-on. This information provides a snapshot of how analysts perceive the current state of the company.
- Rating: Analysts unravel qualitative evaluations for stocks, ranging from 'Outperform' to 'Underperform'. These ratings offer insights into expectations for the relative performance of Snap-on compared to the broader market.
- Price Targets: Analysts explore the dynamics of price targets, providing estimates for the future value of Snap-on's stock. This examination reveals shifts in analysts' expectations over time.
Assessing these analyst evaluations alongside crucial financial indicators can provide a comprehensive overview of Snap-on's market position. Stay informed and make well-judged decisions with the assistance of our Ratings Table.
Stay up to date on Snap-on analyst ratings.
Unveiling the Story Behind Snap-on
Snap-on manufactures premium tools and software for repair professionals. Hand tools are sold through a franchisee-operated mobile van network that serve auto technicians who purchase tools at their own expense. A unique element of its business model is that franchisees bear significant risk, as they must invest in the mobile van, inventory, and software. At the same time, franchisees extend personal credit directly to technicians on an individual tool basis. Snap-on currently operates three segments: repair systems and information, commercial and industrial, and tools. Its finance arm provides financing to franchisees to run their operations, which includes offering loans and leases for mobile vans.
Snap-on's Economic Impact: An Analysis
Market Capitalization Analysis: Reflecting a smaller scale, the company's market capitalization is positioned below industry averages. This could be attributed to factors such as growth expectations or operational capacity.
Decline in Revenue: Over the 3M period, Snap-on faced challenges, resulting in a decline of approximately -3.48% in revenue growth as of 31 March, 2025. This signifies a reduction in the company's top-line earnings. In comparison to its industry peers, the company trails behind with a growth rate lower than the average among peers in the Industrials sector.
Net Margin: Snap-on's net margin is impressive, surpassing industry averages. With a net margin of 21.08%, the company demonstrates strong profitability and effective cost management.
Return on Equity (ROE): Snap-on's ROE is below industry averages, indicating potential challenges in efficiently utilizing equity capital. With an ROE of 4.41%, the company may face hurdles in achieving optimal financial returns.
Return on Assets (ROA): Snap-on's ROA stands out, surpassing industry averages. With an impressive ROA of 3.01%, the company demonstrates effective utilization of assets and strong financial performance.
Debt Management: With a below-average debt-to-equity ratio of 0.23, Snap-on adopts a prudent financial strategy, indicating a balanced approach to debt management.
The Significance of Analyst Ratings Explained
Analysts work in banking and financial systems and typically specialize in reporting for stocks or defined sectors. Analysts may attend company conference calls and meetings, research company financial statements, and communicate with insiders to publish "analyst ratings" for stocks. Analysts typically rate each stock once per quarter.
Analysts may enhance their evaluations by incorporating forecasts for metrics like growth estimates, earnings, and revenue, delivering additional guidance to investors. It is vital to acknowledge that, although experts in stocks and sectors, analysts are human and express their opinions when providing insights.
Which Stocks Are Analysts Recommending Now?
Benzinga Edge gives you instant access to all major analyst upgrades, downgrades, and price targets. Sort by accuracy, upside potential, and more. Click here to stay ahead of the market.
This article was generated by Benzinga's automated content engine and reviewed by an editor.