
Mr. Cooper Gr (NASDAQ:COOP) will release its quarterly earnings report on Wednesday, 2025-04-23. Here's a brief overview for investors ahead of the announcement.
Analysts anticipate Mr. Cooper Gr to report an earnings per share (EPS) of $2.97.
Investors in Mr. Cooper Gr are eagerly awaiting the company's announcement, hoping for news of surpassing estimates and positive guidance for the next quarter.
It's worth noting for new investors that stock prices can be heavily influenced by future projections rather than just past performance.
Overview of Past Earnings
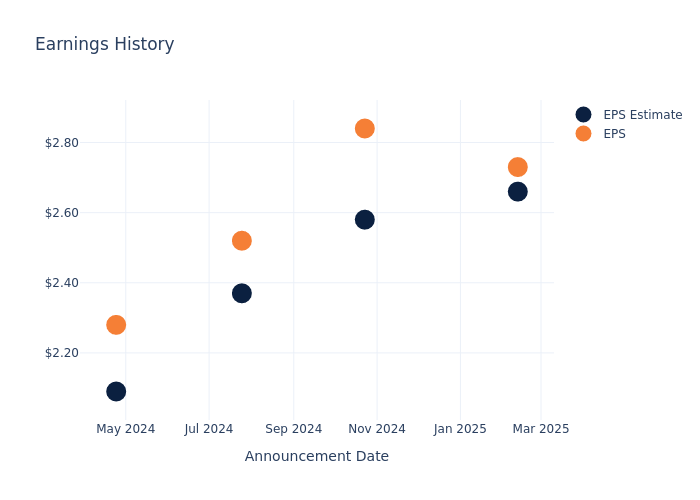
During the last quarter, the company reported an EPS beat by $0.07, leading to a 1.83% increase in the share price on the subsequent day.
Here's a look at Mr. Cooper Gr's past performance and the resulting price change:
| Quarter | Q4 2024 | Q3 2024 | Q2 2024 | Q1 2024 |
|---|---|---|---|---|
| EPS Estimate | 2.66 | 2.58 | 2.37 | 2.09 |
| EPS Actual | 2.73 | 2.84 | 2.52 | 2.28 |
| Price Change % | 2.0% | 2.0% | 2.0% | -4.0% |
Stock Performance
Shares of Mr. Cooper Gr were trading at $107.26 as of April 21. Over the last 52-week period, shares are up 35.68%. Given that these returns are generally positive, long-term shareholders are likely bullish going into this earnings release.
Analysts' Perspectives on Mr. Cooper Gr
Understanding market sentiments and expectations within the industry is crucial for investors. This analysis delves into the latest insights on Mr. Cooper Gr.
With 9 analyst ratings, Mr. Cooper Gr has a consensus rating of Outperform. The average one-year price target is $132.56, indicating a potential 23.59% upside.
Analyzing Ratings Among Peers
The following analysis focuses on the analyst ratings and average 1-year price targets of PennyMac Financial Servs and Walker & Dunlop, three prominent industry players, providing insights into their relative performance expectations and market positioning.
- Analysts currently favor an Outperform trajectory for PennyMac Financial Servs, with an average 1-year price target of $118.0, suggesting a potential 10.01% upside.
- Analysts currently favor an Outperform trajectory for Walker & Dunlop, with an average 1-year price target of $101.67, suggesting a potential 5.21% downside.
Key Findings: Peer Analysis Summary
In the peer analysis summary, key metrics for PennyMac Financial Servs and Walker & Dunlop are highlighted, providing an understanding of their respective standings within the industry and offering insights into their market positions and comparative performance.
| Company | Consensus | Revenue Growth | Gross Profit | Return on Equity |
|---|---|---|---|---|
| Mr. Cooper Gr | Outperform | 54.53% | $464M | 4.32% |
| PennyMac Financial Servs | Outperform | 31.21% | $281.12M | 2.76% |
| Walker & Dunlop | Outperform | 24.46% | $156.35M | 2.45% |
Key Takeaway:
Mr. Cooper Gr ranks highest in Revenue Growth among its peers, with a growth rate of 54.53%. In terms of Gross Profit, Mr. Cooper Gr also leads with a gross profit of $464M. However, when it comes to Return on Equity, Mr. Cooper Gr is at the bottom with a return of 4.32%. Overall, Mr. Cooper Gr outperforms its peers in revenue growth and gross profit but lags behind in return on equity.
All You Need to Know About Mr. Cooper Gr
Mr. Cooper Group Inc is a home loan servicer. The company focuses on delivering a variety of servicing and lending products. It has operating segments namely Servicing segment which performs operational activities on behalf of investors or owners of the underlying mortgages and mortgage servicing rights, including collecting and disbursing borrower payments, investor reporting, and customer service, The Originations segment originates residential mortgage loans through a direct-to-consumer channel, which provides refinance options for existing customers, and through a correspondent channel, which purchases or originates loans from mortgage bankers and brokers, and the Corporate segment. The Servicing segment of the company generates maximum revenue.
Key Indicators: Mr. Cooper Gr's Financial Health
Market Capitalization Analysis: The company's market capitalization surpasses industry averages, showcasing a dominant size relative to peers and suggesting a strong market position.
Revenue Growth: Mr. Cooper Gr's revenue growth over a period of 3 months has been noteworthy. As of 31 December, 2024, the company achieved a revenue growth rate of approximately 54.53%. This indicates a substantial increase in the company's top-line earnings. As compared to its peers, the company achieved a growth rate higher than the average among peers in Financials sector.
Net Margin: Mr. Cooper Gr's net margin is below industry averages, indicating potential challenges in maintaining strong profitability. With a net margin of 23.45%, the company may face hurdles in effective cost management.
Return on Equity (ROE): Mr. Cooper Gr's ROE surpasses industry standards, highlighting the company's exceptional financial performance. With an impressive 4.32% ROE, the company effectively utilizes shareholder equity capital.
Return on Assets (ROA): Mr. Cooper Gr's financial strength is reflected in its exceptional ROA, which exceeds industry averages. With a remarkable ROA of 1.16%, the company showcases efficient use of assets and strong financial health.
Debt Management: With a below-average debt-to-equity ratio of 2.37, Mr. Cooper Gr adopts a prudent financial strategy, indicating a balanced approach to debt management.
To track all earnings releases for Mr. Cooper Gr visit their earnings calendar on our site.
This article was generated by Benzinga's automated content engine and reviewed by an editor.