
Civitas Resources (NYSE:CIVI) underwent analysis by 10 analysts in the last quarter, revealing a spectrum of viewpoints from bullish to bearish.
In the table below, you'll find a summary of their recent ratings, revealing the shifting sentiments over the past 30 days and comparing them to the previous months.
| Bullish | Somewhat Bullish | Indifferent | Somewhat Bearish | Bearish | |
|---|---|---|---|---|---|
| Total Ratings | 2 | 5 | 3 | 0 | 0 |
| Last 30D | 0 | 1 | 0 | 0 | 0 |
| 1M Ago | 0 | 1 | 1 | 0 | 0 |
| 2M Ago | 2 | 2 | 2 | 0 | 0 |
| 3M Ago | 0 | 1 | 0 | 0 | 0 |
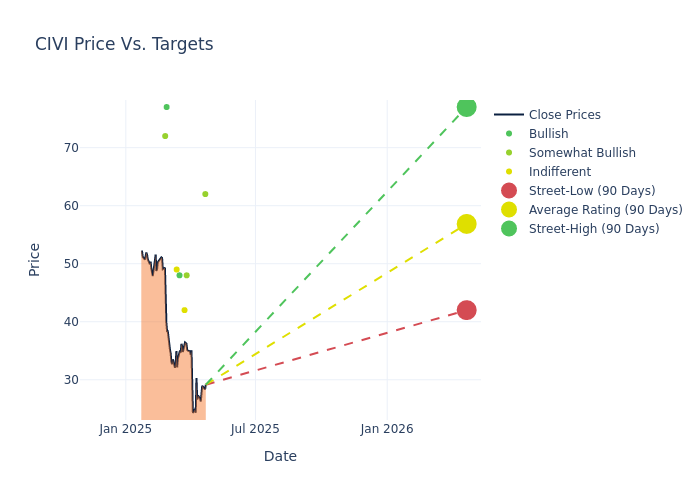
Analysts provide deeper insights through their assessments of 12-month price targets, revealing an average target of $59.7, a high estimate of $77.00, and a low estimate of $42.00. A decline of 13.23% from the prior average price target is evident in the current average.
Investigating Analyst Ratings: An Elaborate Study
The analysis of recent analyst actions sheds light on the perception of Civitas Resources by financial experts. The following summary presents key analysts, their recent evaluations, and adjustments to ratings and price targets.
| Analyst | Analyst Firm | Action Taken | Rating |Current Price Target| Prior Price Target | |--------------------|--------------------|---------------|---------------|--------------------|--------------------| |Mark Lear |Piper Sandler |Lowers |Overweight | $62.00|$66.00 | |Devin McDermott |Morgan Stanley |Lowers |Overweight | $48.00|$70.00 | |Phillip Jungwirth |BMO Capital |Lowers |Market Perform | $42.00|$50.00 | |Lloyd Byrne |Jefferies |Lowers |Buy | $48.00|$73.00 | |Zach Parham |JP Morgan |Lowers |Neutral | $49.00|$62.00 | |Mark Lear |Piper Sandler |Lowers |Overweight | $66.00|$71.00 | |Neal Dingmann |Truist Securities |Lowers |Buy | $77.00|$80.00 | |Zach Parham |JP Morgan |Lowers |Neutral | $62.00|$68.00 | |William Janela |Mizuho |Lowers |Outperform | $72.00|$78.00 | |Mark Lear |Piper Sandler |Raises |Overweight | $71.00|$70.00 |
Key Insights:
- Action Taken: Responding to changing market dynamics and company performance, analysts update their recommendations. Whether they 'Maintain', 'Raise', or 'Lower' their stance, it signifies their response to recent developments related to Civitas Resources. This offers insight into analysts' perspectives on the current state of the company.
- Rating: Analysts unravel qualitative evaluations for stocks, ranging from 'Outperform' to 'Underperform'. These ratings offer insights into expectations for the relative performance of Civitas Resources compared to the broader market.
- Price Targets: Analysts explore the dynamics of price targets, providing estimates for the future value of Civitas Resources's stock. This examination reveals shifts in analysts' expectations over time.
Considering these analyst evaluations in conjunction with other financial indicators can offer a comprehensive understanding of Civitas Resources's market position. Stay informed and make well-informed decisions with our Ratings Table.
Stay up to date on Civitas Resources analyst ratings.
Get to Know Civitas Resources Better
Civitas Resources Inc is an independent exploration and production company engaged in the acquisition, development, and production of oil and associated liquids-rich natural gas in the Rocky Mountain region, in the Denver-Julesburg Basin of Colorado - DJ Basin. The company's operations are focused on developing the horizontal Niobrara and Codell formations that have a low-cost structure, mature infrastructure, production efficiencies, multiple producing horizons, multiple service providers, established reserves, and prospective drilling opportunities.
Civitas Resources: Financial Performance Dissected
Market Capitalization Analysis: The company exhibits a lower market capitalization profile, positioning itself below industry averages. This suggests a smaller scale relative to peers.
Revenue Growth: Civitas Resources displayed positive results in 3M. As of 31 December, 2024, the company achieved a solid revenue growth rate of approximately 14.75%. This indicates a notable increase in the company's top-line earnings. When compared to others in the Energy sector, the company excelled with a growth rate higher than the average among peers.
Net Margin: Civitas Resources's net margin is impressive, surpassing industry averages. With a net margin of 11.7%, the company demonstrates strong profitability and effective cost management.
Return on Equity (ROE): Civitas Resources's ROE excels beyond industry benchmarks, reaching 2.27%. This signifies robust financial management and efficient use of shareholder equity capital.
Return on Assets (ROA): Civitas Resources's ROA excels beyond industry benchmarks, reaching 1.01%. This signifies efficient management of assets and strong financial health.
Debt Management: Civitas Resources's debt-to-equity ratio stands notably higher than the industry average, reaching 0.68. This indicates a heavier reliance on borrowed funds, raising concerns about financial leverage.
What Are Analyst Ratings?
Analysts are specialists within banking and financial systems that typically report for specific stocks or within defined sectors. These people research company financial statements, sit in conference calls and meetings, and speak with relevant insiders to determine what are known as analyst ratings for stocks. Typically, analysts will rate each stock once a quarter.
Some analysts publish their predictions for metrics such as growth estimates, earnings, and revenue to provide additional guidance with their ratings. When using analyst ratings, it is important to keep in mind that stock and sector analysts are also human and are only offering their opinions to investors.
If you want to keep track of which analysts are outperforming others, you can view updated analyst ratings along withanalyst success scores in Benzinga Pro.
Which Stocks Are Analysts Recommending Now?
Benzinga Edge gives you instant access to all major analyst upgrades, downgrades, and price targets. Sort by accuracy, upside potential, and more. Click here to stay ahead of the market.
This article was generated by Benzinga's automated content engine and reviewed by an editor.