
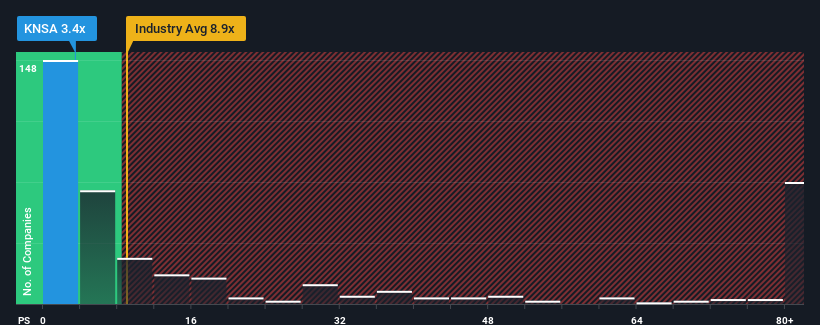
Kiniksa Pharmaceuticals International, plc's (NASDAQ:KNSA) price-to-sales (or "P/S") ratio of 3.4x might make it look like a strong buy right now compared to the Biotechs industry in the United States, where around half of the companies have P/S ratios above 9x and even P/S above 50x are quite common. However, the P/S might be quite low for a reason and it requires further investigation to determine if it's justified.
We check all companies for important risks. See what we found for Kiniksa Pharmaceuticals International in our free report.View our latest analysis for Kiniksa Pharmaceuticals International
How Has Kiniksa Pharmaceuticals International Performed Recently?
Kiniksa Pharmaceuticals International could be doing better as it's been growing revenue less than most other companies lately. Perhaps the market is expecting the current trend of poor revenue growth to continue, which has kept the P/S suppressed. If you still like the company, you'd be hoping revenue doesn't get any worse and that you could pick up some stock while it's out of favour.
Want the full picture on analyst estimates for the company? Then our free report on Kiniksa Pharmaceuticals International will help you uncover what's on the horizon.Is There Any Revenue Growth Forecasted For Kiniksa Pharmaceuticals International?
In order to justify its P/S ratio, Kiniksa Pharmaceuticals International would need to produce anemic growth that's substantially trailing the industry.
Retrospectively, the last year delivered an exceptional 57% gain to the company's top line. This great performance means it was also able to deliver immense revenue growth over the last three years. Accordingly, shareholders would have been over the moon with those medium-term rates of revenue growth.
Shifting to the future, estimates from the six analysts covering the company suggest revenue should grow by 24% per year over the next three years. That's shaping up to be materially lower than the 169% per annum growth forecast for the broader industry.
With this in consideration, its clear as to why Kiniksa Pharmaceuticals International's P/S is falling short industry peers. It seems most investors are expecting to see limited future growth and are only willing to pay a reduced amount for the stock.
The Key Takeaway
We'd say the price-to-sales ratio's power isn't primarily as a valuation instrument but rather to gauge current investor sentiment and future expectations.
As we suspected, our examination of Kiniksa Pharmaceuticals International's analyst forecasts revealed that its inferior revenue outlook is contributing to its low P/S. Shareholders' pessimism on the revenue prospects for the company seems to be the main contributor to the depressed P/S. It's hard to see the share price rising strongly in the near future under these circumstances.
Many other vital risk factors can be found on the company's balance sheet. You can assess many of the main risks through our free balance sheet analysis for Kiniksa Pharmaceuticals International with six simple checks.
Of course, profitable companies with a history of great earnings growth are generally safer bets. So you may wish to see this free collection of other companies that have reasonable P/E ratios and have grown earnings strongly.
Have feedback on this article? Concerned about the content? Get in touch with us directly. Alternatively, email editorial-team (at) simplywallst.com.
This article by Simply Wall St is general in nature. We provide commentary based on historical data and analyst forecasts only using an unbiased methodology and our articles are not intended to be financial advice. It does not constitute a recommendation to buy or sell any stock, and does not take account of your objectives, or your financial situation. We aim to bring you long-term focused analysis driven by fundamental data. Note that our analysis may not factor in the latest price-sensitive company announcements or qualitative material. Simply Wall St has no position in any stocks mentioned.