
Many investors define successful investing as beating the market average over the long term. But its virtually certain that sometimes you will buy stocks that fall short of the market average returns. Unfortunately, that's been the case for longer term Ashland Inc. (NYSE:ASH) shareholders, since the share price is down 49% in the last three years, falling well short of the market return of around 30%. The more recent news is of little comfort, with the share price down 47% in a year. Shareholders have had an even rougher run lately, with the share price down 27% in the last 90 days. Of course, this share price action may well have been influenced by the 14% decline in the broader market, throughout the period.
Now let's have a look at the company's fundamentals, and see if the long term shareholder return has matched the performance of the underlying business.
Our free stock report includes 4 warning signs investors should be aware of before investing in Ashland. Read for free now.While markets are a powerful pricing mechanism, share prices reflect investor sentiment, not just underlying business performance. One way to examine how market sentiment has changed over time is to look at the interaction between a company's share price and its earnings per share (EPS).
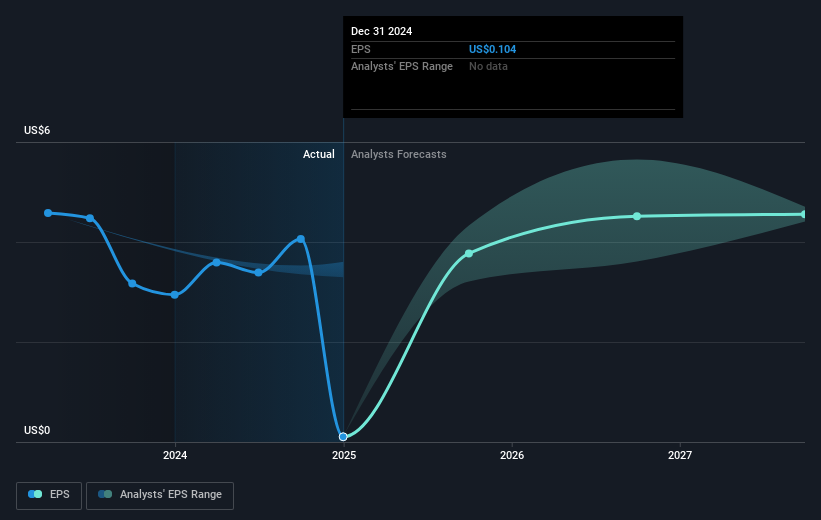
Ashland saw its EPS decline at a compound rate of 66% per year, over the last three years. In comparison the 20% compound annual share price decline isn't as bad as the EPS drop-off. So the market may not be too worried about the EPS figure, at the moment -- or it may have previously priced some of the drop in. With a P/E ratio of 485.51, it's fair to say the market sees a brighter future for the business.
You can see how EPS has changed over time in the image below (click on the chart to see the exact values).
It's probably worth noting we've seen significant insider buying in the last quarter, which we consider a positive. That said, we think earnings and revenue growth trends are even more important factors to consider. It might be well worthwhile taking a look at our free report on Ashland's earnings, revenue and cash flow.
What About Dividends?
As well as measuring the share price return, investors should also consider the total shareholder return (TSR). The TSR is a return calculation that accounts for the value of cash dividends (assuming that any dividend received was reinvested) and the calculated value of any discounted capital raisings and spin-offs. Arguably, the TSR gives a more comprehensive picture of the return generated by a stock. In the case of Ashland, it has a TSR of -47% for the last 3 years. That exceeds its share price return that we previously mentioned. The dividends paid by the company have thusly boosted the total shareholder return.
A Different Perspective
While the broader market gained around 5.2% in the last year, Ashland shareholders lost 45% (even including dividends). Even the share prices of good stocks drop sometimes, but we want to see improvements in the fundamental metrics of a business, before getting too interested. Regrettably, last year's performance caps off a bad run, with the shareholders facing a total loss of 1.4% per year over five years. We realise that Baron Rothschild has said investors should "buy when there is blood on the streets", but we caution that investors should first be sure they are buying a high quality business. I find it very interesting to look at share price over the long term as a proxy for business performance. But to truly gain insight, we need to consider other information, too. For instance, we've identified 4 warning signs for Ashland (2 can't be ignored) that you should be aware of.
Ashland is not the only stock insiders are buying. So take a peek at this free list of small cap companies at attractive valuations which insiders have been buying.
Please note, the market returns quoted in this article reflect the market weighted average returns of stocks that currently trade on American exchanges.
Have feedback on this article? Concerned about the content? Get in touch with us directly. Alternatively, email editorial-team (at) simplywallst.com.
This article by Simply Wall St is general in nature. We provide commentary based on historical data and analyst forecasts only using an unbiased methodology and our articles are not intended to be financial advice. It does not constitute a recommendation to buy or sell any stock, and does not take account of your objectives, or your financial situation. We aim to bring you long-term focused analysis driven by fundamental data. Note that our analysis may not factor in the latest price-sensitive company announcements or qualitative material. Simply Wall St has no position in any stocks mentioned.