
In the latest quarter, 8 analysts provided ratings for Lithia Motors (NYSE:LAD), showcasing a mix of bullish and bearish perspectives.
The table below summarizes their recent ratings, showcasing the evolving sentiments within the past 30 days and comparing them to the preceding months.
| Bullish | Somewhat Bullish | Indifferent | Somewhat Bearish | Bearish | |
|---|---|---|---|---|---|
| Total Ratings | 3 | 3 | 2 | 0 | 0 |
| Last 30D | 1 | 0 | 0 | 0 | 0 |
| 1M Ago | 1 | 1 | 1 | 0 | 0 |
| 2M Ago | 0 | 0 | 0 | 0 | 0 |
| 3M Ago | 1 | 2 | 1 | 0 | 0 |
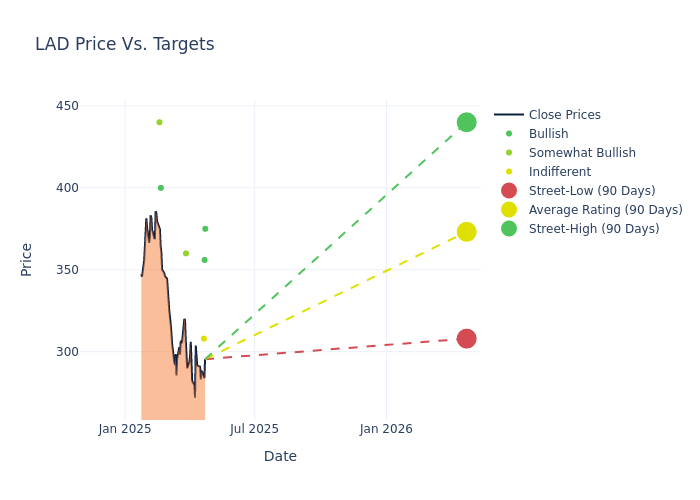
Analysts have recently evaluated Lithia Motors and provided 12-month price targets. The average target is $382.0, accompanied by a high estimate of $440.00 and a low estimate of $308.00. Experiencing a 4.35% decline, the current average is now lower than the previous average price target of $399.38.
Analyzing Analyst Ratings: A Detailed Breakdown
The perception of Lithia Motors by financial experts is analyzed through recent analyst actions. The following summary presents key analysts, their recent evaluations, and adjustments to ratings and price targets.
| Analyst | Analyst Firm | Action Taken | Rating |Current Price Target| Prior Price Target | |--------------------|--------------------|---------------|---------------|--------------------|--------------------| |Ronald Josey |Citigroup |Lowers |Buy | $375.00|$415.00 | |Ronald Jewsikow |Guggenheim |Lowers |Buy | $356.00|$417.00 | |Colin Langan |Wells Fargo |Lowers |Equal-Weight | $308.00|$397.00 | |Rajat Gupta |JP Morgan |Lowers |Overweight | $360.00|$420.00 | |Michael Albanese |Benchmark |Maintains |Buy | $400.00|$400.00 | |Rajat Gupta |JP Morgan |Raises |Overweight | $420.00|$400.00 | |Douglas Dutton |Evercore ISI Group |Raises |Outperform | $440.00|$400.00 | |Colin Langan |Wells Fargo |Raises |Equal-Weight | $397.00|$346.00 |
Key Insights:
- Action Taken: Responding to changing market dynamics and company performance, analysts update their recommendations. Whether they 'Maintain', 'Raise', or 'Lower' their stance, it signifies their response to recent developments related to Lithia Motors. This offers insight into analysts' perspectives on the current state of the company.
- Rating: Analysts assign qualitative assessments to stocks, ranging from 'Outperform' to 'Underperform'. These ratings convey the analysts' expectations for the relative performance of Lithia Motors compared to the broader market.
- Price Targets: Delving into movements, analysts provide estimates for the future value of Lithia Motors's stock. This analysis reveals shifts in analysts' expectations over time.
Navigating through these analyst evaluations alongside other financial indicators can contribute to a holistic understanding of Lithia Motors's market standing. Stay informed and make data-driven decisions with our Ratings Table.
Stay up to date on Lithia Motors analyst ratings.
Delving into Lithia Motors's Background
Lithia Motors is a retailer of new and used vehicles and related services. The company offers over 50 brands of vehicles at nearly 500 stores globally across the US, Canada, and UK. The company has expanded largely through the acquisition of dealerships in smaller regional markets but now seeks to grow in any part of the US and we expect more deals over time in the US and, at times, abroad. Annual revenue in 2024 was $36.2 billion and we see over $50 billion possible in a few years. The US was 78% of 2024 revenue and the UK second at 19%, due to the 2024 Pendragon acquisition. In 2024, new vehicle sales were about 49% of total revenue. Lithia was founded in 1946, went public in 1996, and is the largest US auto dealer. It is based in Medford, Oregon.
Lithia Motors's Economic Impact: An Analysis
Market Capitalization: Surpassing industry standards, the company's market capitalization asserts its dominance in terms of size, suggesting a robust market position.
Revenue Growth: Over the 3M period, Lithia Motors showcased positive performance, achieving a revenue growth rate of 19.54% as of 31 December, 2024. This reflects a substantial increase in the company's top-line earnings. As compared to its peers, the company achieved a growth rate higher than the average among peers in Consumer Discretionary sector.
Net Margin: Lithia Motors's net margin is impressive, surpassing industry averages. With a net margin of 2.36%, the company demonstrates strong profitability and effective cost management.
Return on Equity (ROE): Lithia Motors's ROE excels beyond industry benchmarks, reaching 3.26%. This signifies robust financial management and efficient use of shareholder equity capital.
Return on Assets (ROA): Lithia Motors's ROA stands out, surpassing industry averages. With an impressive ROA of 0.93%, the company demonstrates effective utilization of assets and strong financial performance.
Debt Management: Lithia Motors's debt-to-equity ratio is below the industry average. With a ratio of 2.08, the company relies less on debt financing, maintaining a healthier balance between debt and equity, which can be viewed positively by investors.
How Are Analyst Ratings Determined?
Analysts work in banking and financial systems and typically specialize in reporting for stocks or defined sectors. Analysts may attend company conference calls and meetings, research company financial statements, and communicate with insiders to publish "analyst ratings" for stocks. Analysts typically rate each stock once per quarter.
Some analysts will also offer forecasts for metrics like growth estimates, earnings, and revenue to provide further guidance on stocks. Investors who use analyst ratings should note that this specialized advice comes from humans and may be subject to error.
Breaking: Wall Street's Next Big Mover
Benzinga's #1 analyst just identified a stock poised for explosive growth. This under-the-radar company could surge 200%+ as major market shifts unfold. Click here for urgent details.
This article was generated by Benzinga's automated content engine and reviewed by an editor.